


 GBPJPY Coil Tightens: Is a Bullish Break Above 215.60 Imminent?
  Geopolitical Easing Fuels AUDJPY Rally Toward 115 — Buy Dips at 113
  FxWirePro- Woodies pivot (Major)
  Relief Rally Extends to 112.75, but AUDJPY EMA Structure Favors Selling
  FxWirePro: USD/JPY gains above 160 level ahead of BOJ policy meeting
  FxWirePro- Woodies pivot (Major)
  FxWirePro- Major Crypto levels and bias summary
  FxWirePro: AUD/USD climbs as US-Iran peace deal sparks risk rally
  FxWirePro: AUD/ USD strongly bearish despite upside attempts
  Peace Dividend Powers NZDJPY Past 93.50 — Bulls Set Sights on 96.15 Target
  FxWirePro: GBP/USD range-bound as Iran uncertainty keeps traders cautious
  Sell the Bounce: NZDJPY Bearish Bias Persists Below 94.20, Eyes 90.50
  FxWirePro: NZD/USD jumps after US and Iran agree preliminary deal
  FxWirePro: GBP/AUD eases on Geopolitical whipsaw


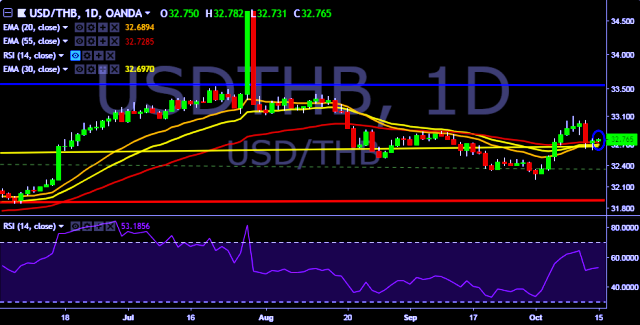
- USD/THB is currently trading around 32.75 marks.
- It made intraday high at 32.78 and low at 32.73 marks.
- Intraday bias remains slightly bullish for the moment.
- On the top side, key resistances are seen at 32.90, 33.05, 33.20, 33.37, 33.52, 33.78 and 33.96 marks respectively.
- Alternatively, a daily close below 32.75 will drag the parity down towards key supports around 32.60, 32.46, 32.27, 32.18, 32.02 and 31.85 marks respectively.
- Important to note here that 20D, 30D and 55D EMA heads down and confirms the bearish trend in a daily chart.
We prefer to take long position on USD/THB only above 32.78, stop loss 32.70 and target of 32.90/33.05.


