


 FxWirePro: USD/CAD slips after Fed holds rates steady
  FxWirePro: GBP/NZD maintains bersish bias with focus on 2.2900 level
  FxWirePro: USD/ZAR retreats but trend is still bullish
  Crypto Action Bias: ETHUSD Stands Out as the Bullish Pair to Watch
  Buy the Dips on EUR/JPY: Bullish Structure Points to 188 Target Ahead of Fed
  FxWirePro: EUR/ AUD gains some ground , but remains on bearish path
  EUR/JPY Holds Bullish Bias as Euro Extends Recovery
  FxWirePro: AUD/USD falls after softer-than-expected Australian Q2 CPI
  FxWirePro- Woodies pivot (Major)
  FxWirePro: GBP/USD edges higher as traders await BoE guidance and UK fiscal clarity
  FxWirePro: NZD/USD neutral in the near-term, scope for downward resumption
  FxWirePro: USD/JPY eases ahead of Fed decision , Intervention risks linger
  FxWirePro- Woodies pivot (Major)
  AUDJPY Weakness Deepens: Sell Rallies Toward 112 as Aussie Dollar Falters
  FxWirePro: GBP/USD edges lower ahead of Fed policy verdict
  NZD/JPY Flatlines Near 94.60: Will Key Support Reignite the Uptrend?


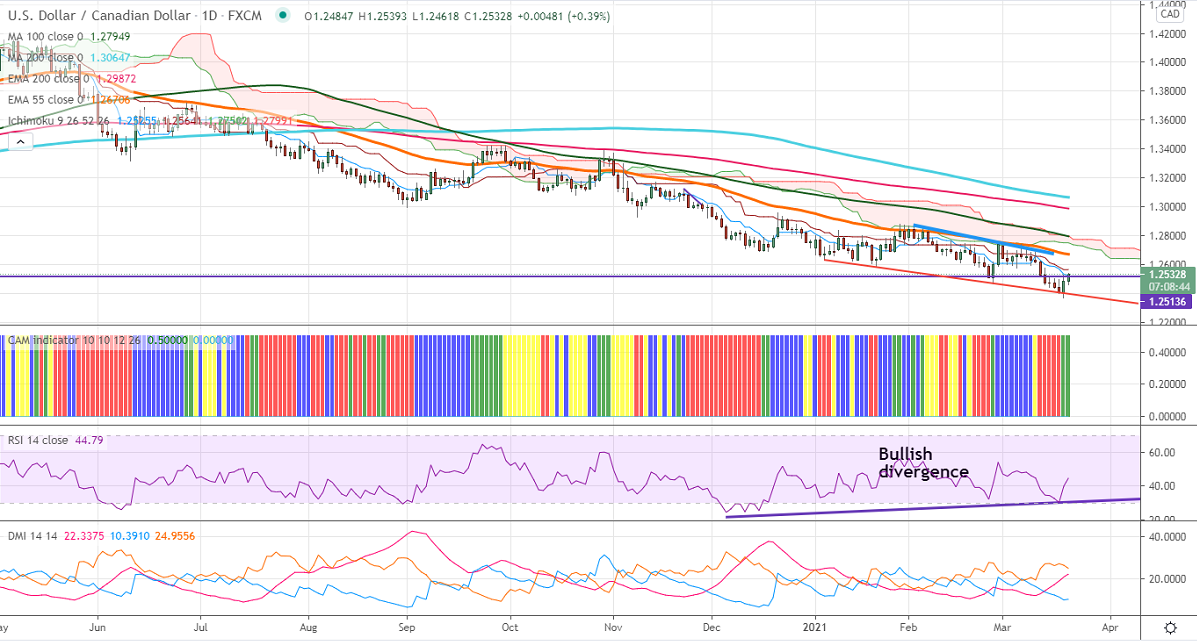
Bullish Divergence (Daily Chart)
Ichimoku analysis (Daily Chart)
Tenken-Sen- 1.25327
Kijun-Sen- 1.25641
USDCAD has taken support near trend line and shown a minor recovery till 1.25200 despite better than expected Canadian retail sales. It has declined by 1.1% in January compared to a forecast of -2.8%. The US 10-year yield jumped sharply from a minor low of 1.67% is supporting the US dollar at lower levels. DXY is trading higher and holding above 92 levels. A jump till 92.60 likely.
WTI crude oil declined sharply nearly 15% on strong US dollar and vaccine rollout delayed. The overall trend is bearish as long as resistance $67 holds.
Technically, the pair faces near-term resistance at 1.2530. Any indicative break above will take till 1.2570/1.2625. The significant support is around 1.2460; an indicative violation below will take to the 1.2430/1.2360.
Indicator (1 Hour chart)
CAM indicator – Bullish
Directional movement index –Bearish
It is good to buy on dips around 1.2518-20 with SL around 1.24600 for a TP of 1.2660.


