Technicals

Add as a preferred source on Google

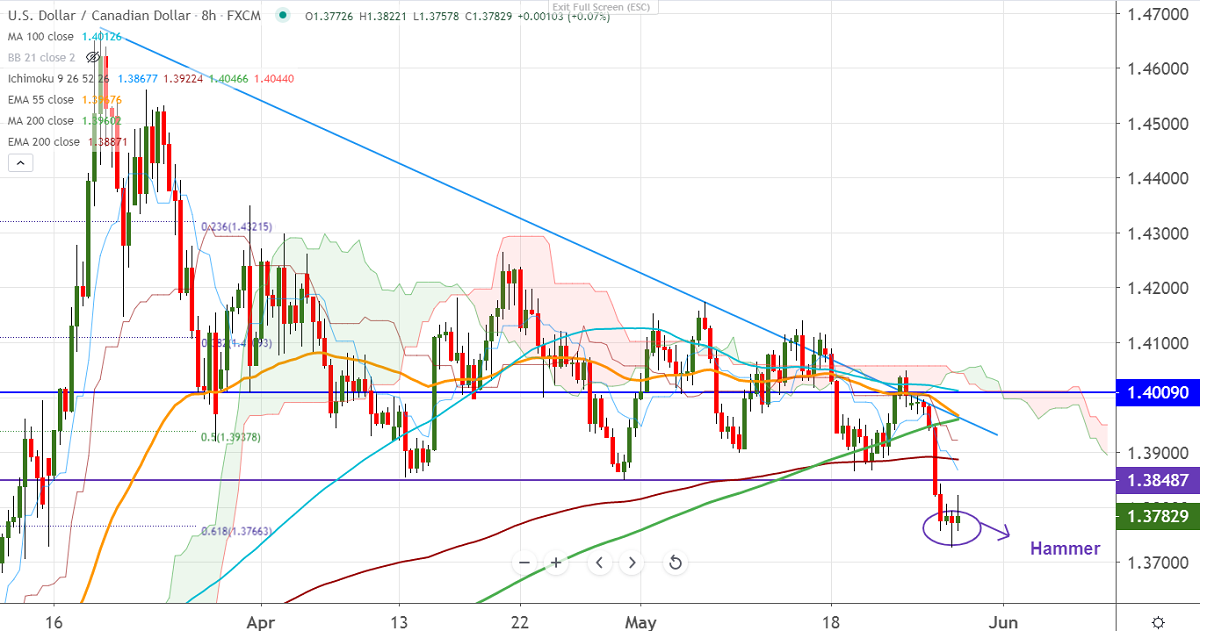
FxWirePro: USDCAD forms hammer pattern, jump till 1.4000 likely

Candlestick pattern-Hammer Ichimoku Analysis (8- hour chart) Tenken-Sen- 1.39345 Kijun-Sen- 1.39806 USDCAD has halted its 4 days of bearishness and jumped more than 80 pips on weak crude oil prices. WTI crude oil price l…

1 min read
FxWirePro: USDCAD forms hammer pattern, jump till 1.4000 likely
Image from the original EconoTimes article

Read the original article

Candlestick pattern-Hammer


Ichimoku Analysis (8- hour chart)


Tenken-Sen- 1.39345


Kijun-Sen- 1.39806


USDCAD has halted its 4 days of bearishness and jumped more than 80 pips on weak crude oil prices. WTI crude oil price lost more than 7.5% due to the ongoing Hong Kong protest. It hits an intraday low of $32.16 and is currently trading around $32.72. 


Technically, significant support stands at 1.3720, and any violation below targets 1.3680/1.3600. The near term resistance is at 1.3850 (support turned into resistance), an indicative break above will take the pair to the next level till 1.3890/1.3950.


It is good to buy on dips around 1.3785 with SL around 1.3720 for the TP of 1.4000.

 

Related articles

View all
Technicals

Major Pair Currency Score: AUDUSD Bearish

EURUSD - Levels to watch - 1.100 GBPUSD Levels to watch - 1.3180 USDCHF Levels to watch - 0.8400 USDCAD - Levels to watch - 1.4300 AUDUSD - Levels to watch - 0.7000 NZDUSD - Levels to watch - 0.5560

