


 FxWirePro: AUD/USD bulls struggles as upside momentum fades
  BTCUSD Holds Above 365 EMA as Bullish Momentum Builds Toward $70K
  FxWirePro: EUR/NZD outlook weaker on renewed downside pressure
  Major Crypto Action Bias: BTC, ETH & SOL Turn Bullish – SOLUSD Leads as the Top Pair to Watch
  FxWirePro: GBP/USD falls as investors assess Britain's political transition
  ETHUSD Breaks Above $1900 as Bulls Eye $2300 and Beyond
  NZDJPY Bullish Above 95: Buy Dips Toward 97 as Kiwi Strength Holds Firm
  FxWirePro: EUR/ AUD dips below 1.6300 level, focus on near term support
  FxWirePro:GBP/AUD slips as markets assess Burnham's rise to UK premiership
  FxWirePro: USD/ZAR slips as rand gains on U.S.-Iran developments
  FxWirePro :USD/JPY drifts above 162 as range trading persists
  FxWirePro: GBP/NZD downtrend loses steam, remains on bearish path
  FxWirePro: USD/CAD retains bid tone,eyes 1.4200 level
  FxWirePro: GBP/USD slips as Middle East tensions boost safe-haven dollar
  FxWirePro:USD/JPY hovers near 40-year peak,intervention fears linger
  JPY Action Bias: Bullish Winds Strengthen – NZDJPY Leads the Charge as Top Pair to Watch
  FxWirePro- USD/CHF Holds Above 0.8120 as Bulls Target 0.8200


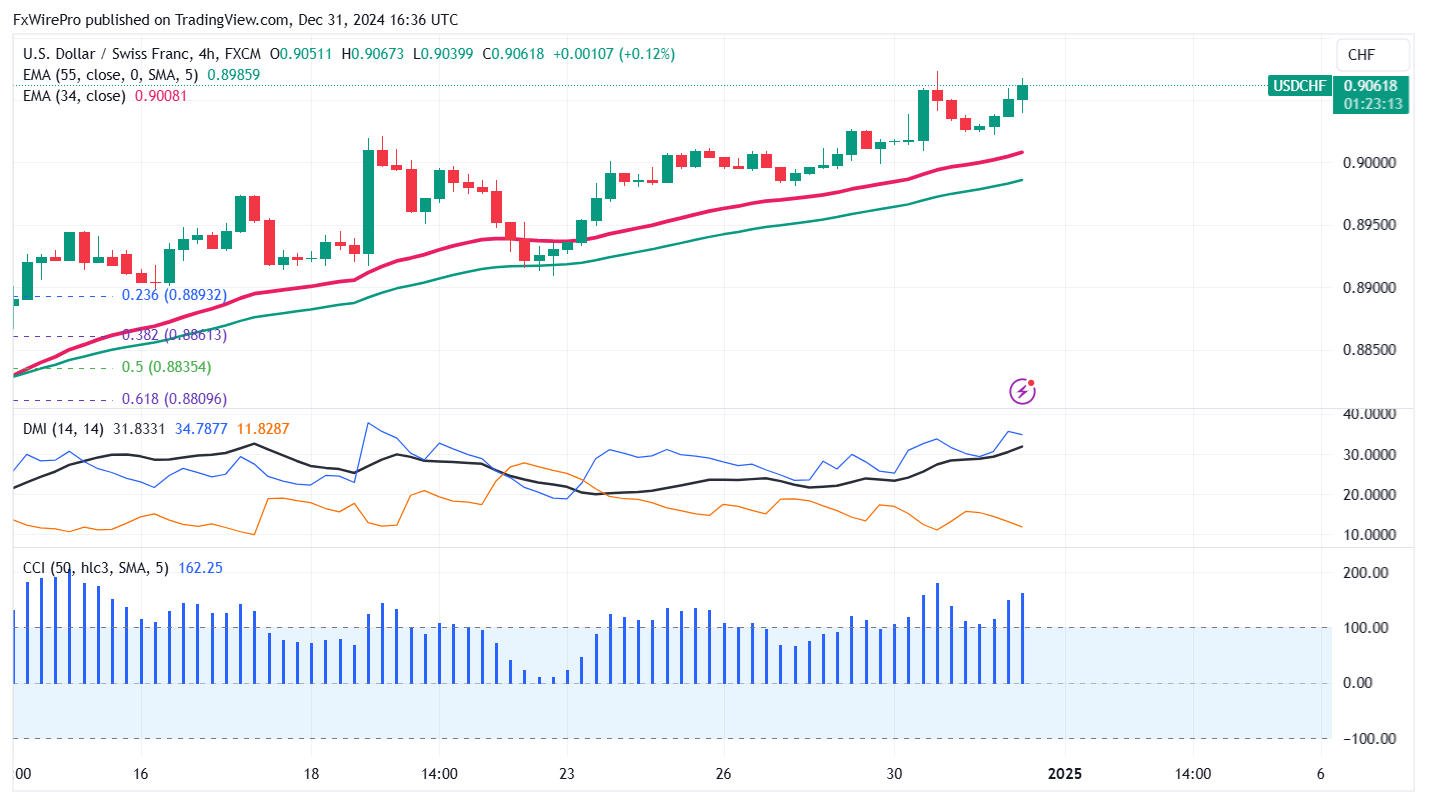
The currency pair trades above 0.9050 on board-based US dollar buying.It recently hit a high of 0.90729 and is currently trading around 0.90588. The intraday bias is bullish as long as the support level at 0.8890 holds.
The S&P CoreLogic Case-Shiller 20-City Composite Home Price Index shows a year-over-year increase of 4.2% as of October 2024, matching expectations. This indicates stability in the housing market despite past fluctuations. However, the index's growth has slightly cooled, as it was 4.6% in September 2024. Month-over-month, the index declined by 0.3%, continuing a trend seen in recent months. This data suggests that while home prices are still rising, the rate of growth is slowing due to various economic factors.
Technical Indicators for Potential Uptrend
The pair is trading above both the 34-EMA and 55-EMA on the 4-hour chart, suggesting a potential uptrend. The next resistance level to watch is at 0.9080; a breakthrough could lead to targets at 0.9100 and 0.9150. If the pair drops below 0.8750, it would signal the end of the downtrend that started from 0.9225 and completed at 0.8375.
Support and Resistance Levels
Immediate support for the pair is at 0.8980. If this level is breached, the pair could decline to 0.8940/0.8890, 0.8850, 0.8835, and 0.8600. Additional levels to monitor include 0.8580, 0.8550, 0.8525, and a significant Fibonacci projection at 0.8365.
Caution in Trading Strategy
The 4-hour chart shows a bullish trend in the Commodity Channel Index (CCI) and Average Directional Movement Index (ADX) suggesting bullish signals for traders.
Recommended Trading Approach
It is advisable to consider buying on dips around 0.9030, with a stop-loss set at 0.8980 and a target price of 0.9070 for potential gains.


