


 FxWirePro: USD/JPY uptrend loses steam, remains on bullish path
  AUDJPY Bullish Surge: Strong Australian Dollar Fuels Fresh Upside as Pair Holds Above 113.50 and All EMAs Align
  Major Pair Action Bias: Extremely Bullish Surge Powers GBPUSD & NZDUSD as Bullish Momentum Ignites
  JPY Action Bias: Extremely Bullish Surge Ignites Across NZD, GBP & AUD
  FxWirePro:EUR/NZD dips below lower range, bearish bias increases
  FxWirePro- Major Crypto levels and bias summary
  FxWirePro- Major Pair levels and bias summary
  FxWirePro: USD/ZAR advances as South African rand weakens amid renewed Middle East tensions
  FxWirePro: GBP/NZD gains some upside momentum but still bearish
  FxWirePro: GBP/USD hits one-month high, scope for further upside
  FxWirePro- Woodies pivot (Major)
  FxWirePro- Major Pair levels and bias summary
  Crypto Major Pair Action Bias: ETHUSD Bullish as BTCUSD, SOLUSD & XRPUSD Stay Neutral
  FxWirePro: NZD/USD trades in narrow range ,outlook bullish


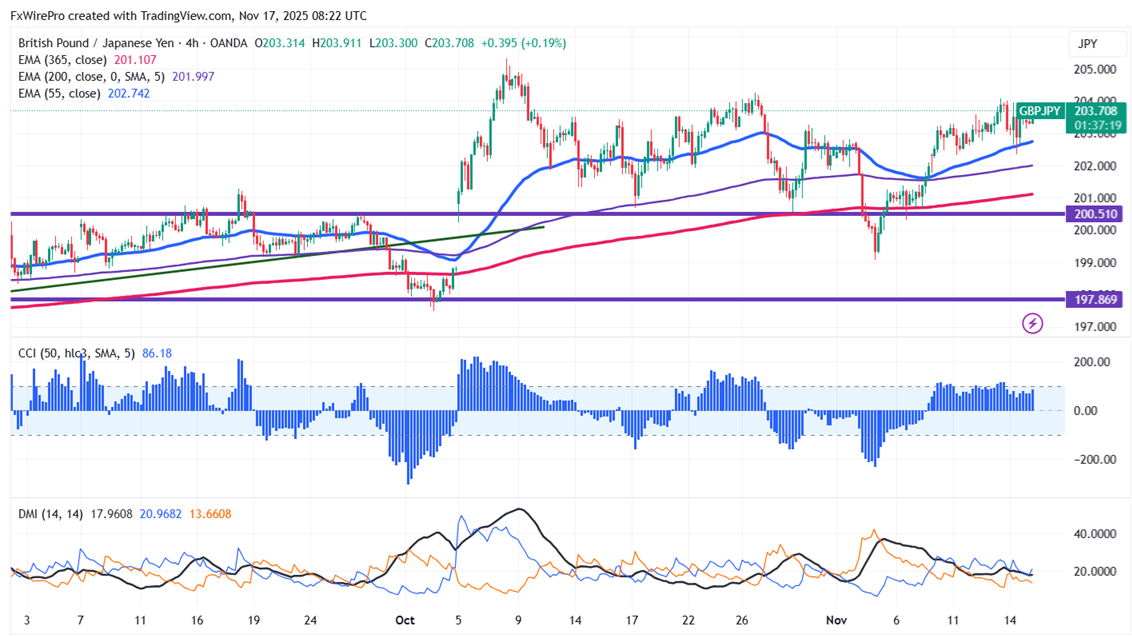
GBPJPY gained above the 203.50 level on board-based yen weakness. The intraday trend is bullish as long as support at 203 holds. It hits an intraday high of 203.91 and is currently trading around 203.72.
Oscillators and moving averages to forecast the trend of GBPJPY
CMP- 203.73
EMA (4-hour chart)
55-EMA- 202.70
200-EMA- 201.98
365-EMA- 201.09. The pair trades above the short (55- EMA) and long term moving average(365 EMA and 200 EMA) and 200 EMA.
Major Support- 203. Any breach below will drag the pair down 202.50/202/201.70/201.25/200.
Major resistance - 204.35. Any break above confirms minor bullishness, a jump 205/206 is possible.
Indicator (4 hour chart)
CCI (50)- Bullish
Average directional movement Index- Bullish. All indicators confirm a bullish trend.
It is good to buy on dips around 202.58-60 with SL around 202 for a TP of 204/205.


