


 FxWirePro: USD/CNY drifts lower, vulnerable to more downside
  FxWirePro- Major Pair levels and bias summary
  Bitcoin Resilience: BTC Reclaims USD 69,000 as Geopolitical Tensions Ease
  FxWirePro:NZD/USD remains vulnerable as Trump's latest deadline leaves investors on edge
  FxWirePro: EUR/ NZD consolidating around 2.0200, room for further gains
  FxWirePro: EUR/AUD eases slightly but trend is still bullish
  FxWirePro- Major Crypto levels and bias summary
  Kiwi Under Pressure: NZDJPY Signals Bearish Turn as Resistance at 92.00 Holds Firm
  FxWirePro- Woodies Pivot(Major)
  FxWirePro- Major European Indices
  FxWirePro- Major European Indices
  Ethereum Retreats Toward USD 2,000: Technicals Signal Caution as ETH Mimics Bitcoin’s Pullback
  Euro Retreats as Geopolitical Tensions Surge: EURUSD Eyes 1.1400 Floor Amid Safe-Haven Demand
  Pound Under Pressure as Yen Stabilizes: GBPJPY Bears Target 208 as Key EMAs Hold Resistance


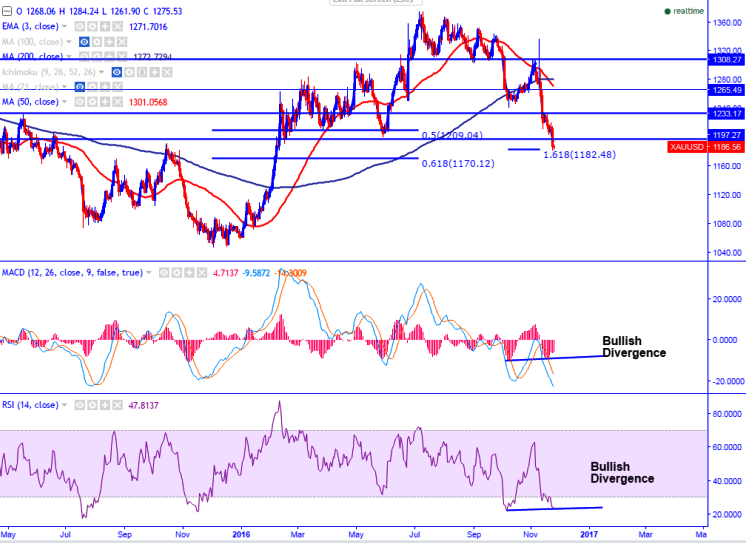
- Major support - $1180 (161.8% retracement of $1337 and $1241.50)
- Minor resistance- $1200 (3- day EMA)
- Pattern Formed- Bullish Divergence (MACD and RSI)
- Gold has broken major pschycological support at $1200 and declined sharply till $1182 yesterday. It is currently trading around $1186.
- The yellow metal‘s overall trend is weak but the MACD and RSI in the daily chart is showing Bullish divergence. So, slight jump till $1200 is possible.
- Short term bullishness only above $1235.
- On the lower side, any break below $1180 will drag the commodity down till $1170 (61.8% retracement of $1375 and $1046)/$1160 level.
It is good to buy on dips around $1180 with SL around $1170 for the TP of $1200


