
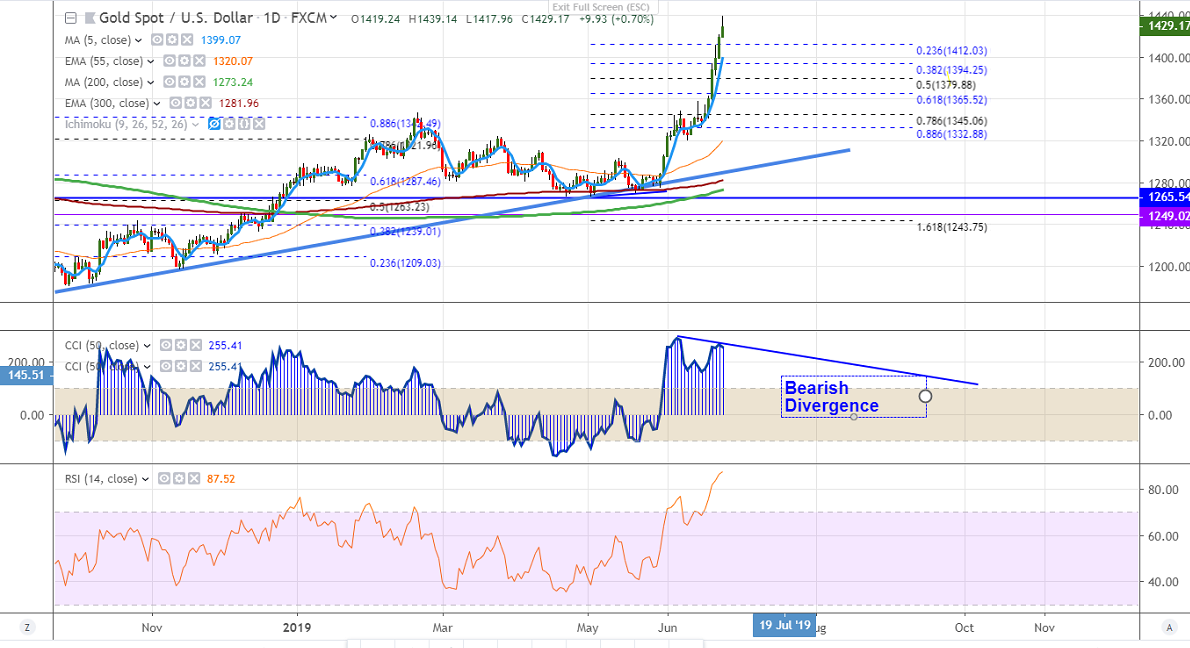
Chart pattern Bearish divergence
Gold has shown nearly $20 from the high of $1439 on account of profit booking. The yellow metal was trading higher for 1 week and jumped nearly $100 after the dovish Fed meeting. The escalation of geopolitical tension between the US and Iran is also supporting the gold price.
US dollar index continues to trade lower and is trading below 300-day EMA.This confirms further weakness and a decline till 95 is possible.
US 10 year yield is also in the oversold zone and bullish divergence in CCI (50) shows that there will be a slight jump which is slightly negative for gold.
Technically, near term resistance is around $1440 and any break above that level targets $1460/$1480.
On the flip side, near term support is around $1411 (23.6% fib of $1275 and $1411.70) and any break below confirms minor weakness and a dip till $1400/$1382.
It is good to sell on rallies around $1434-35 with SL around $1442 for the TP of $1382.


