


 EURUSD Spikes to 1.14306 on Fed Pause as Traders Eye Sell-the-Rally Setup
  FxWirePro: GBP/NZD remains weak, eyes 38.2%fib support
  JPY Action Bias: EURJPY and CADJPY Emerge as Extremely Bullish Pairs to Watch
  FxWirePro- Major Crypto levels and bias summary
  FxWirePro : GBP/NZD strongly bearish despite upside attempts
  NZDJPY Bullish Rebound: Buy Dips as EMAs Align for 97 Target
  Nikkei Surges Past 65,000 on Suspected Yen Weakness: Tech Giants Like Advantest and NEC Lead Explosive Gains
  FxWirePro: USD/CAD slips after Fed holds rates steady
  Major FX Action Bias & US Market Sentiment: NZD/USD (Extremely Bullish) & AUD/USD (Bullish) Watchlist
  FxWirePro: AUD/USD dips below lower range, bearish bias increases
  FxWirePro:EUR/NZD gains some upside momentum but still bearish
  FxWirePro: USD/ CNY hits one-month low,scope for futher downside
  FxWirePro- Major Crypto levels and bias summary
  FxWirePro: USD/ZAR firms ahead of Fed interest rate decision
  FxWirePro: EUR/AUD regains upwards momentum but unable to hold above 50%fib level
  FxWirePro: GBP/USD edges lower ahead of Fed policy verdict


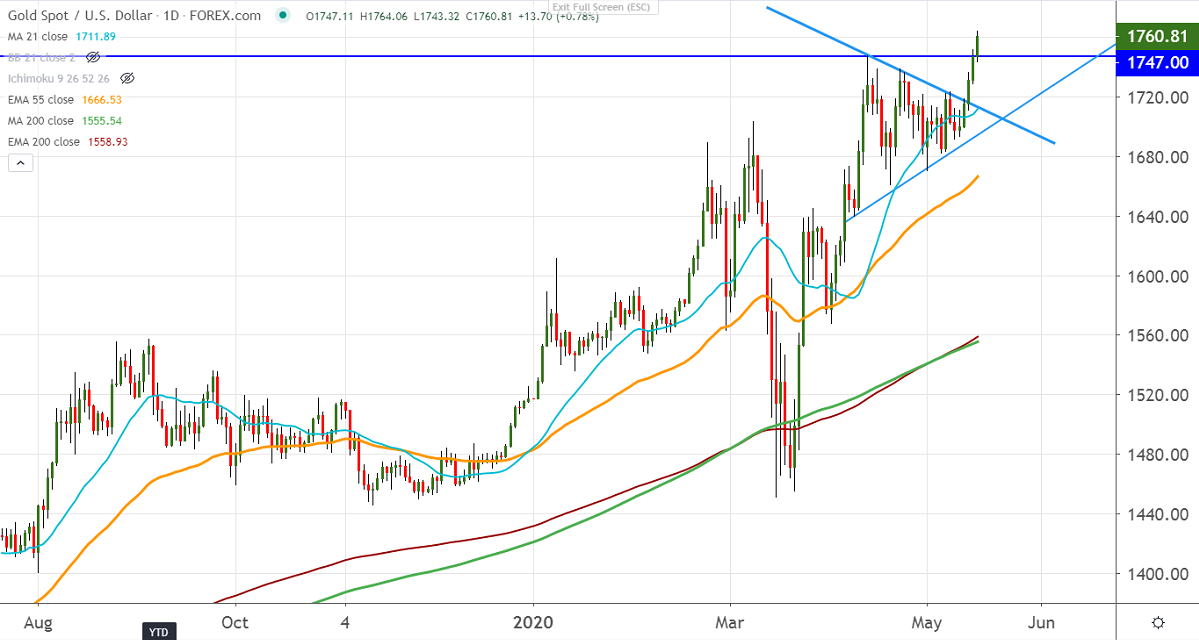
Chart pattern- symmetrical triangle break out
Gold continues to trade higher for 2nd consecutive week, jumped more than $80 from low made on $1682. The weak U.S economic data released this month has increased hopes of more stimulus from the Fed. It hits a high of $1764.06 at the time of writing and is currently trading around $1761.53.
US economic data:
US economy lost nearly 20 .5 million jobs in Apr vs forecast of -22 million and the unemployment rate at 14.7%, the highest level since the 1930s. The Broader U6 unemployment rate surged to record 22.8% from 8.7%.
The total number of filing for unemployment benefits totaled 2.981 million last week, jobless claims during coronavirus crisis rose to 36.5 million.
Technicals:
The yellow metal is holding well above the symmetrical triangle and this confirms the primary trend continuation. From here, it is expected to reach $1800 (161.8% fib)/1825 in the near term.
On the flipside, near term support stands at $1708 (21-day MA) and daily close below will drag down gold till $1690/$1660. The bearish continuation can happen only if it breaks $1660.
It is good to buy on dips around $1741-42 with SL around $1728 for the TP of $1800.


