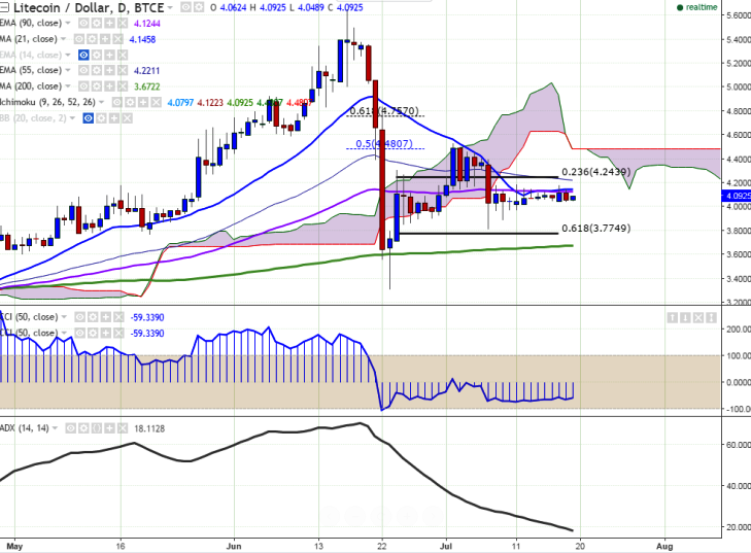
LTC/USD continued its choppy trade seen from the past several days. The pair has been unable to break above the 90 EMA and continues to trade below it. It currently trades at 4.08 levels at the time of writing. Ichimoku …
LTC/USD continued its choppy trade seen from the past several days. The pair has been unable to break above the 90 EMA and continues to trade below it. It currently trades at 4.08 levels at the time of writing.
Ichimoku analysis of daily chart:
Tenkan Sen: 4.07
Kijun Sen: 3.92
Trend reversal – 4.12 (90 EMA)
The pair faces major resistance at $4.22 (55 day EMA) and a break above would see the pair testing $4.48 (50% retracement of $5.65 and $3.311)/$4.75. On the flipside, support is eyed at $3.81 (Jul 7th 2016 high) and any weakness below this level would drag the pair to $3.63 (200 day MA)/$3.311 (Jun 23 rd low).
Coinglass measured Ether options open interest at $5.81 billion, up 0.1% from the previous day, with calls representing most of both open interest and trading volume.