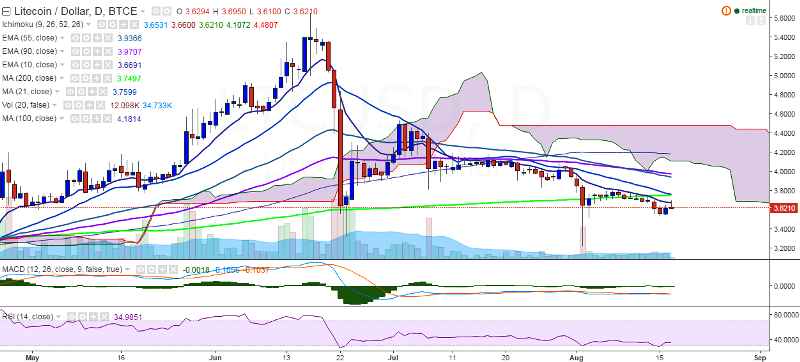
After recovering losses on Tuesday, LTC/USD today briefly broke above 10 EMA and hit 3.69 levels. However, the pair lost momentum and slid below the trend line, and is currently trading at 3.62 levels at the time of writing (BTC-e).
Ichimoku analysis of daily chart:
Tenkan Sen: 3.6682
Kijun Sen: 3.6600
Trend reversal: 3.74 levels (200-day MA)
The pair faces major resistance at 3.74 levels (200-day MA) and break above would target 3.97 (90 EMA)/4.18 (100-day MA). On the other side, support is seen at 3.53 levels (August 15 low) and break below would see the pair plunging to 3.22 (August 2 low)/3.00.