


 FxWirePro- Major Crypto levels and bias summary
  BTC’s Bear Bounce: Sell the Rally Near $66K as Bears Target $59K–$52K Breakdown
  FxWirePro- Major Crypto levels and bias summary


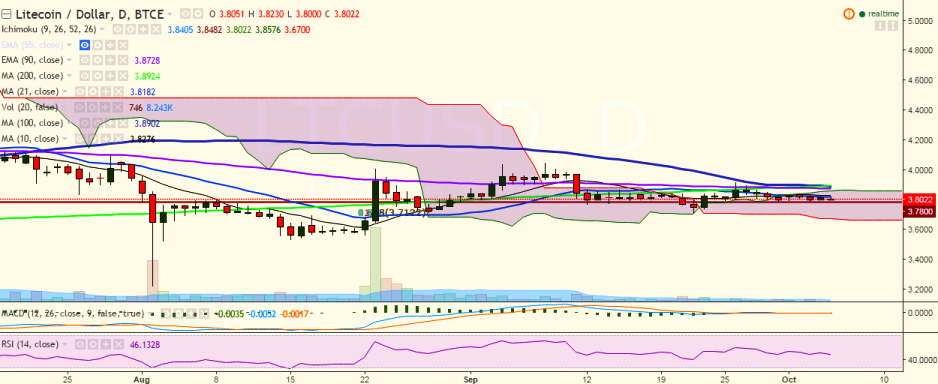
LTC/USD continued its downward trend on Wednesday and is trading at 3.80 levels at the time of writing (BTC-e).
Long-term trend: Bearish
Ichimoku analysis of daily chart:
Tenkan Sen: 3.84
Kijun Sen: 3.85
Trend reversal: 3.87 (90 EMA)
The pair’s upside is being capped by 3.82 (10-DMA) and a break above would take it to 3.88 (200-DMA)/ 3.91 (September 26 high)/ 4.05 (September 08 high).
On the reverse side, support is likely to be found at 3.78 (September 30 low) and any weakness below this level would target 3.70 (September 22 low)/3.50 (psychological level).

- News

- Economy

- Central Banks
- Investing
- Research
- Roundups
- Digital Currency
- Insights
- Technical Analysis
- Technology
- Business
- Law
- Health
- Nature
- Fintech
- Science
- Topic
- Opinions
- ©Econometrics LLC . All Rights Reserved.
LTC/USD trades weaker, eyes 3.78
Wednesday, October 5, 2016 11:37 AM UTC
Editor's Picks


- Market Data
Most Popular


