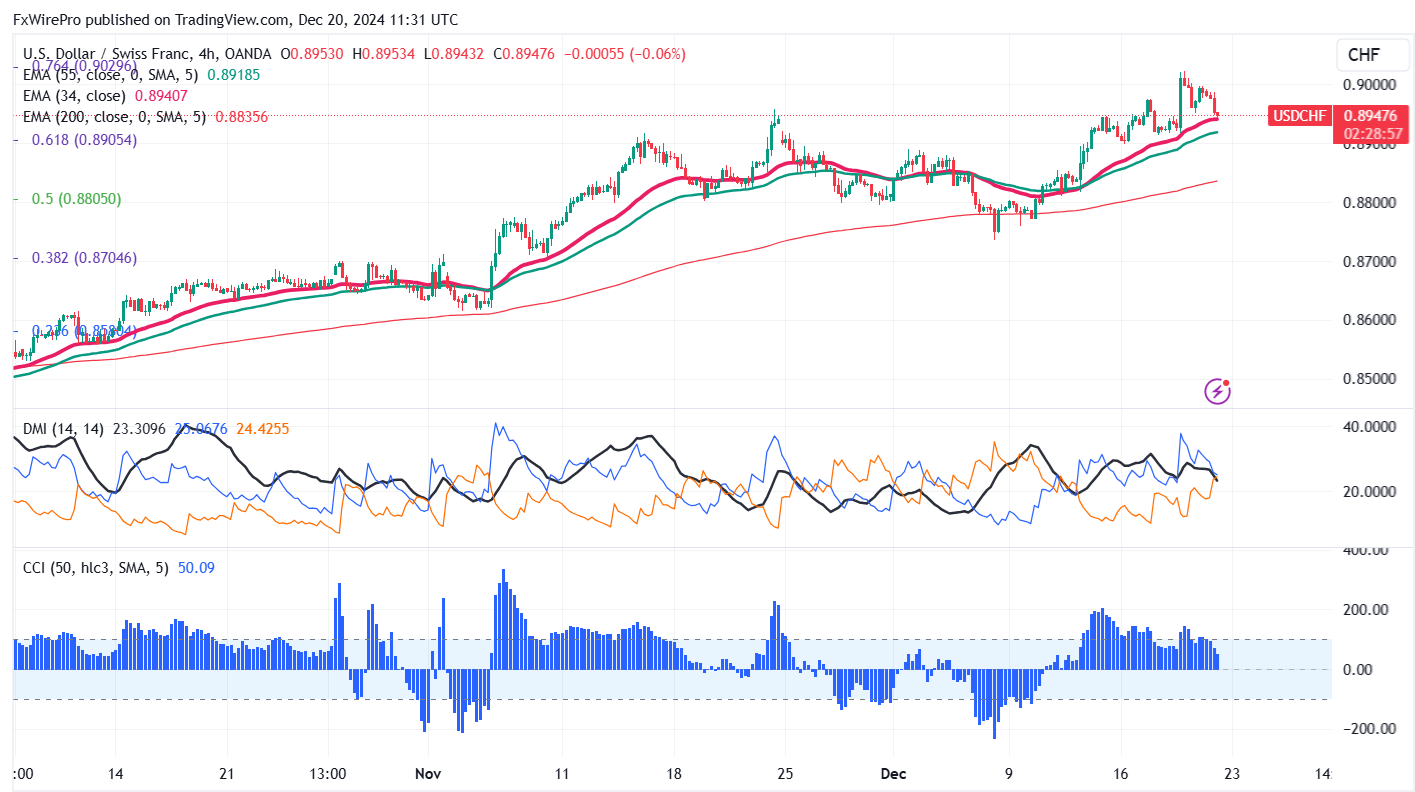
The currency pair pared most of its gains made after the hawkish Fed rate cut. Intraday bias remains bullish as long as the support level at 0.8890 holds. The pair reached a low of 0.89432 and is currently trading around 0.89492.
Mixed Economic Signals Ahead of US PCE Data
On December 19, 2024, two important economic reports were released for the U.S. economy. The final estimate of Gross Domestic Product (GDP) for the third quarter showed that the economy grew at an annual rate of 3.1%, revised up from 2.8%, mainly due to strong consumer spending and exports. Additionally, initial jobless claims fell to 215,000, down from 228,000, indicating a strong job market with fewer people seeking unemployment benefits. In contrast, the Philadelphia Federal Reserve's Manufacturing Business Outlook Survey revealed a significant decline in manufacturing activity, with the Philly Fed Manufacturing Index dropping to -16.4, far below expectations. New orders and shipments also decreased, reflecting lower demand for manufactured goods. The employment index showed a slowdown in hiring, and while prices paid by manufacturers increased, their pricing power weakened. Overall, these reports present a mixed picture of the economy as it heads into 2025, with both positive signs and challenges in the manufacturing sector.
Technical Analysis Signals Potential Uptrend
The pair is currently trading above both the 34-EMA and the 55-EMA on the 4-hour chart, indicating a potential uptrend. The near-term resistance level is at 0.9000; a break above this could lead to targets at 0.9030, 0.9070, and 0.9100. A break above 0.87500 confirms that the decline from 0.9225 has completed at 0.83750.
Support and Resistance Levels to Monitor
Immediate support is at 0.8940. If this level is broken, the pair could decline to 0.8890, 0.8850, 0.8835, and down to 0.8600. Additional levels to watch include 0.8580, 0.8550, 0.8525, and 0.8499, with a significant Fibonacci projection at 0.8365.
Mixed Trend Indicators Demand Cautious Trading
On the 4-hour chart, the Commodity Channel Index (CCI) is showing a bullish trend, while the Average Directional Movement Index indicates a neutral trend. Overall, the trend remains mixed.
Trading Strategy: Buy on Dips for Potential Gains
Consider sell on rallies around the support level of 0.89580-60, with a stop-loss set at 0.9000 and a target price of 0.8780.


