Technicals

Add as a preferred source on Google

NZDJPY Bearish Blueprint: Selling the Rallies as Resistance Holds Firm

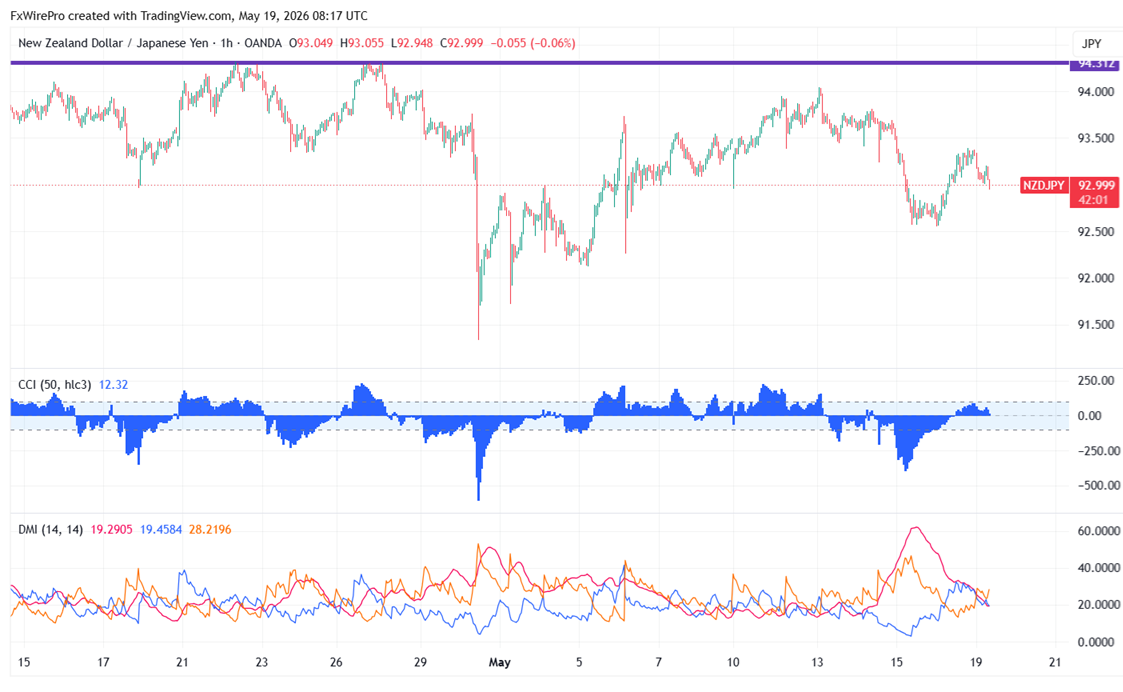
NZDJPY trades in a narrow range between 94.04 and 92.55 for the past three days. It reached an intraday high of 93.37 and is currently trading near 93. If the 94.40 resistance holds, the downward trend seems to be going …

1 min read
NZDJPY Bearish Blueprint: Selling the Rallies as Resistance Holds Firm
Image from the original EconoTimes article

Read the original article


NZDJPY trades in a narrow range between 94.04 and 92.55 for the past three days.  It reached an intraday high of 93.37 and is currently trading near 93. If the 94.40 resistance holds,  the downward   trend seems to be going well.


Technicals

CMP -93.59

Trend

1- Hour chart

Value


55 EMA

93.13

CMP<value

Bearish

200- EMA

93.27

CMP <value

Bearish

365- EMA

93.27

CMP<value

Bearish

 Near-term resistance - 94/94.50/95/96. Near-term support- 92.70/91.80/91/90.50/89.

Momentum indicator

Inference

Value

CCI(50)

Bullish

43.30

ADX

Neutral


 It is good to sell on rallies around 93.58-60  with SL around 94.40 for a TP of 90.



Related articles

View all
Technicals

Major Pair Currency Score: AUDUSD Bearish

EURUSD - Levels to watch - 1.100 GBPUSD Levels to watch - 1.3180 USDCHF Levels to watch - 0.8400 USDCAD - Levels to watch - 1.4300 AUDUSD - Levels to watch - 0.7000 NZDUSD - Levels to watch - 0.5560

