


 FxWirePro: EUR/AUD outlook weaker on renewed downside pressure
  FxWirePro: USD/CAD falls after BoC rate hold and weak U.S. producer inflation
  GBPJPY Bullish on Consolidation: Holds Above 216 After 218 Top – Buy Dips at 217 Targeting 220
  FxWirePro:EUR/NZD dips below lower range, bearish bias increases
  FxWirePro: NZD/USD trades in narrow range ,outlook bullish
  FxWirePro: NZD/USD steadies around 0.5830,retains bid tone
  Crypto Major Pair Action Bias: ETHUSD Bullish as BTCUSD, SOLUSD & XRPUSD Stay Neutral
  FxWirePro: AUD/USD edges lower, but bullish outlook persists
  FxWirePro: GBP/NZD gains some upside momentum but still bearish
  JPY Action Bias: Extremely Bullish Surge Ignites Across NZD, GBP & AUD
  FxWirePro: GBP/USD hits one-month high, scope for further upside
  AUDJPY Extremely Bullish Above 113: Strong AUD Fuels Fresh Rally – Buy Dips at 113 Targeting 115
  GBPUSD, AUDUSD & NZDUSD Turn Extremely Bullish: Strong Positive Momentum Drives Major Pair Action Bias
  NZDJPY Extremely Bullish Above 94: Broad NZD Buying Fuels Fresh Upside – Buy Dips at 93.70 Targeting 95
  GBPJPY Bullish Surge: Strong Pound Ignites Fresh Upside on Fed-BOE Policy Divergence as All EMAs Align
  FxWirePro:EUR/NZD extends fall, key support lies ahead


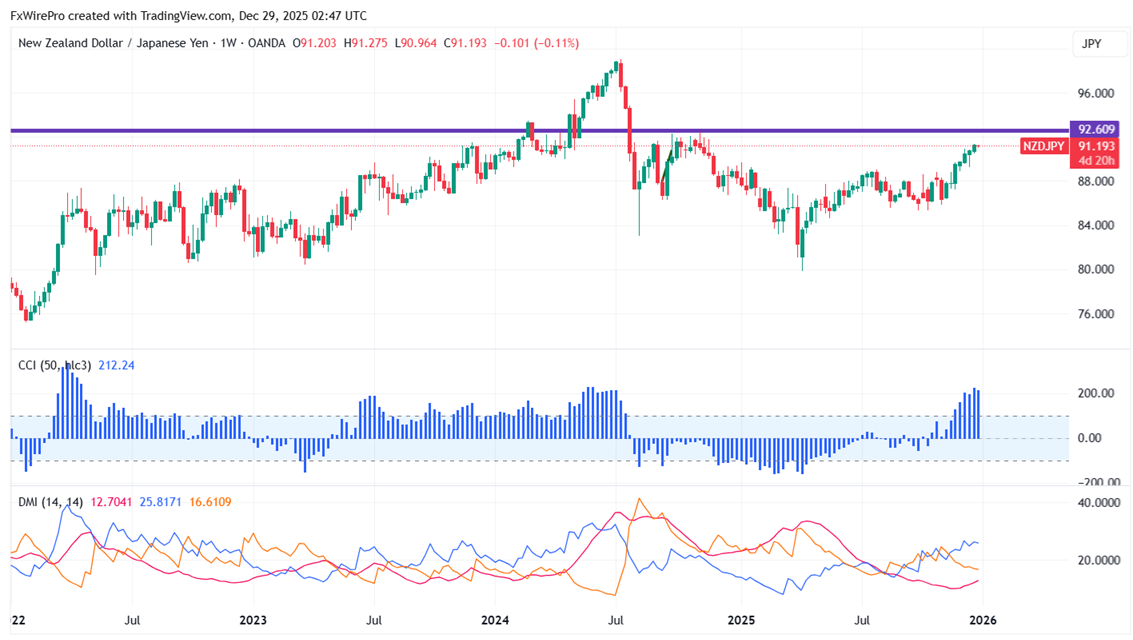
NZDJPY has been stabilizing within a tight range of 91.36 and 90.49 for last week. The intraday trend is neutral as long as resistance at 91.50 prevails. The couple peaked at 91.36; it trades now at roughly 91.17.
Oscillators and moving averages to forecast the trend of NZDJPY
CMP- 91.17
EMA (Weekly chart)
55-EMA- 87.95
200-EMA- 86.26
365-EMA- 83.65. The pair trades above the short (55 EMA) and long-term moving average(200 and 365).
Major support- 90.45. Any breach below will drag the pair down to 90/89.70/89.20/88.70/88.40/87.99.
Major resistance - 91.50. Any break above 91.50 confirms minor bullishness, a jump to 92/93.
Indicator (Weekly chart)
CCI (50)- bullish
Average directional movement Index- Neutral. All indicators confirm a mixed trend.
It is good to buy on dips around 90.68-70 with SL around 90 for the TP of 92.


