


 FxWirePro: AUD/USD edges lower, but bullish outlook persists
  FxWirePro: GBP/NZD downtrend loses steam, remains on bearish path
  FxWirePro:EUR/NZD stuck In narrow ranges, focus on near term support
  FxWirePro- Woodies pivot (Major)
  JPY Action Bias: Extremely Bullish Surge Ignites Across NZD, GBP & AUD
  FxWirePro: USD/CAD falls after BoC rate hold and weak U.S. producer inflation
  FxWirePro: GBP/USD under pressure despite UK's modest economic growth
  FxWirePro: USD/JPY uptrend loses steam, remains on bullish path
  FxWirePro: GBP/NZD gains some upside momentum but still bearish
  ETH Stands Alone Bullish; BTC, SOL, XRP, BNB Neutral
  EUR/USD Holds Bullish Tone Despite Pullback from Yesterday’s High
  FxWirePro:EUR/NZD dips below lower range, bearish bias increases
  FxWirePro: EUR/AUD neutral in the near term, scope for downward resumption
  FxWirePro: USD/ZAR advances as South African rand weakens amid renewed Middle East tensions
  AUDJPY Bullish Surge: Strong Australian Dollar Fuels Fresh Upside as Pair Holds Above 113.50 and All EMAs Align
  NZDJPY Bullish Surge: Strong Kiwi Ignites Fresh Upside as 94 Support Holds and All EMAs Align
  FxWirePro- Major Pair levels and bias summary


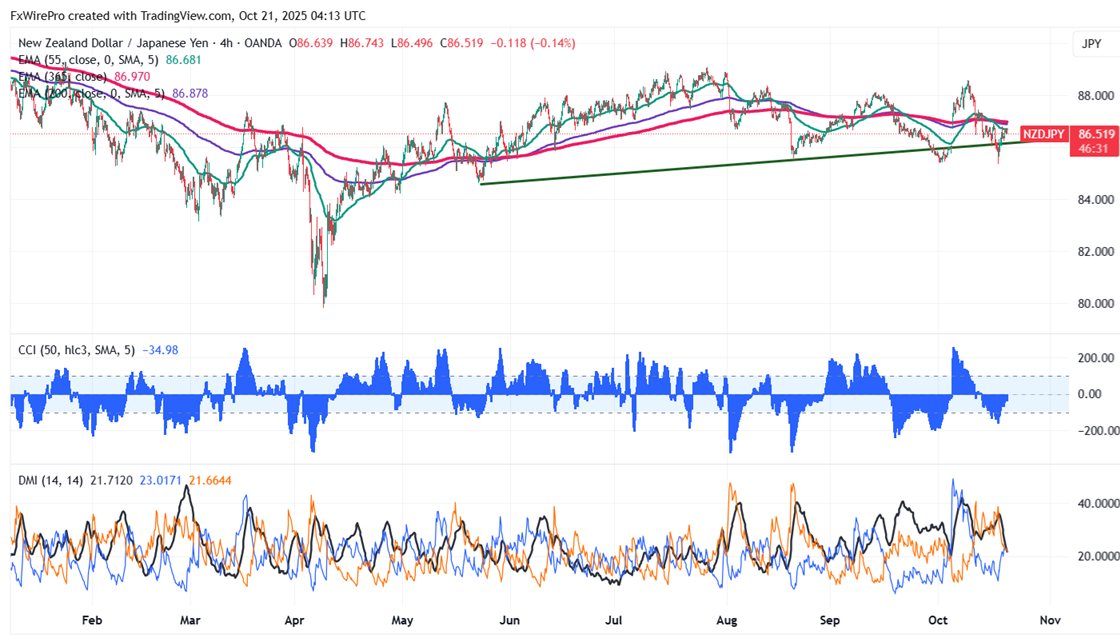
NZDJPY formed double bottom near 85.35 and showed a minor pullback on weak yen. As long as resistance 86.86-87 holds, the intraday trend is bearish. Having hit an intraday high of 86.74, it currently trades at roughly 86.52. Overall trend is still weak if pair trades below 89.20.
Oscillators and moving averages to forecast the trend of NZDJPY
CMP- 86.49
EMA (4-hour chart)
55-EMA- 86.68
200-EMA- 86.88
365-EMA- 86.97. The pair trades below the short and below long-term moving average.
Major support- 86.40. Any breach below will drag the pair down to 86/85.37.
Major resistance - 86.86. Any break above 86.86 confirms minor bullishness, a jump to 87.50/88.10/88.50/89.25.
Indicator (4 hour chart)
CCI (50)- bearish
Average directional movement Index- Neutral. All indicators confirm a mixed trend.
It is good to sell on rallies 86.78-80 with SL around 87.50 for TP of 85.32/85.


