


 GBPJPY Bullish on Consolidation: Holds Above 216 After 218 Top – Buy Dips at 217 Targeting 220
  Crypto Major Pair Action Bias: ETHUSD Bullish as BTCUSD, SOLUSD & XRPUSD Stay Neutral
  FxWirePro: NZD/USD steadies around 0.5830,retains bid tone
  FxWirePro: AUD/USD edges lower, but bullish outlook persists
  GBPUSD, AUDUSD & NZDUSD Turn Extremely Bullish: Strong Positive Momentum Drives Major Pair Action Bias
  FxWirePro: GBP/NZD gains some upside momentum but still bearish
  FxWirePro: NZD/USD trades in narrow range ,outlook bullish
  FxWirePro:EUR/NZD extends fall, key support lies ahead
  FxWirePro:EUR/NZD dips below lower range, bearish bias increases
  FxWirePro: AUD/USD remains buoyant, looks to extend gains
  ETH Stands Alone Bullish; BTC, SOL, XRP, BNB Neutral
  FxWirePro :USD/JPY bulls loosen their grip a bit, dips to be bought
  Major Pair Action Bias: Extremely Bullish Surge Powers GBPUSD & NZDUSD as Bullish Momentum Ignites
  NZDJPY Bullish Surge: Strong Kiwi Ignites Fresh Upside as 94 Support Holds and All EMAs Align


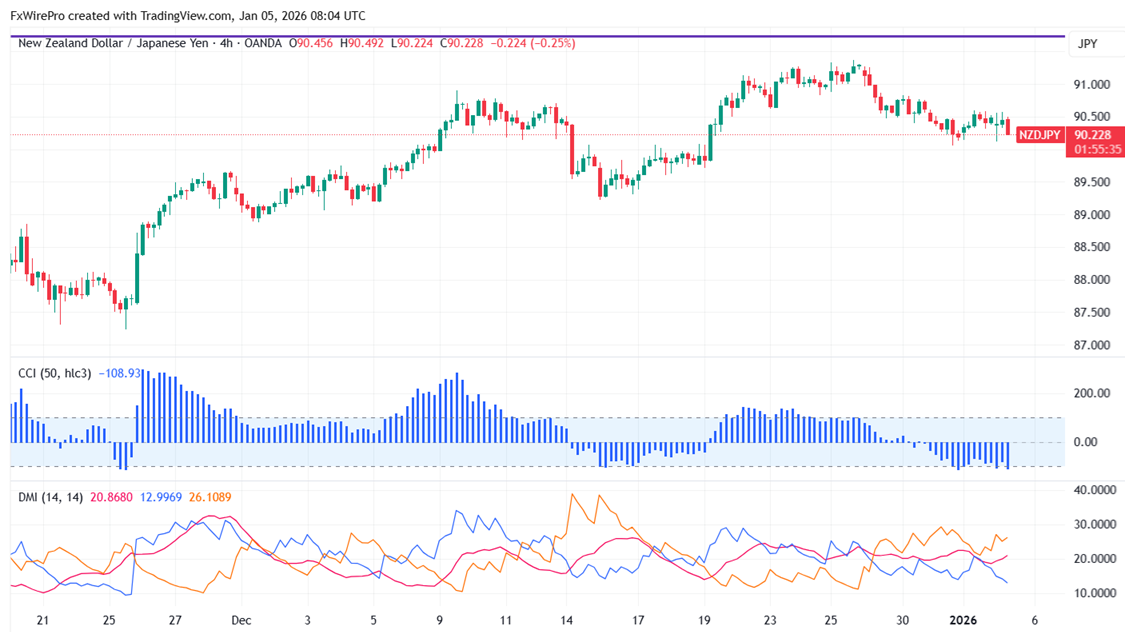
NZDJPY traded in a narrow range between 90.60 and 90.045 in the past two days. As long as resistance at 91.50 persists, the intraday trend is bearish. The pair reached an intraday low of 90.11; it currently trades at around 90.24.
Oscillators and moving averages to forecast the trend of NZDJPY
CMP- 90.58
EMA (4-hour chart)
55-EMA- 90.53
200-EMA- 89.71
365-EMA- 88.99. The pair trades below the short (55 EMA) and above the long-term moving average(200 and 365).
Major support- 90. Any breach below will drag the pair down to 90/89.70/89.20/88.70/88.40/87.99.
Major resistance - 90.85. Any break above 90.85 confirms minor bullishness, a jump to 91.50/92/93.
Indicator (4-hour chart)
CCI (50)- bearish
Average directional movement Index- Bearish. All indicators confirm a bearish trend.
It is good to sell on rallies around 90.48-50 with SL around 91.50 for the TP of 88.40.


