


 Gold Loses Steam After Strong U.S. Retail Sales
  AUDJPY Bullish Surge: Strong Australian Dollar Fuels Fresh Upside as Pair Holds Above 113.50 and All EMAs Align
  GBPJPY Bullish Surge: Strong Pound Ignites Fresh Upside on Fed-BOE Policy Divergence as All EMAs Align
  EUR/USD Holds Bullish Tone Despite Pullback from Yesterday’s High
  FxWirePro: NZD/USD trades in narrow range ,outlook bullish
  FxWirePro: GBP/USD under pressure despite UK's modest economic growth
  JPY Action Bias: Extremely Bullish Surge Ignites Across NZD, GBP & AUD
  FxWirePro- Major Pair levels and bias summary
  FxWirePro:EUR/NZD dips below lower range, bearish bias increases
  FxWirePro: USD/ZAR advances as South African rand weakens amid renewed Middle East tensions
  ETH Stands Alone Bullish; BTC, SOL, XRP, BNB Neutral
  GBPUSD, AUDUSD & NZDUSD Turn Extremely Bullish: Strong Positive Momentum Drives Major Pair Action Bias
  FxWirePro: USD/CAD falls after BoC rate hold and weak U.S. producer inflation
  FxWirePro: USD/JPY uptrend loses steam, remains on bullish path


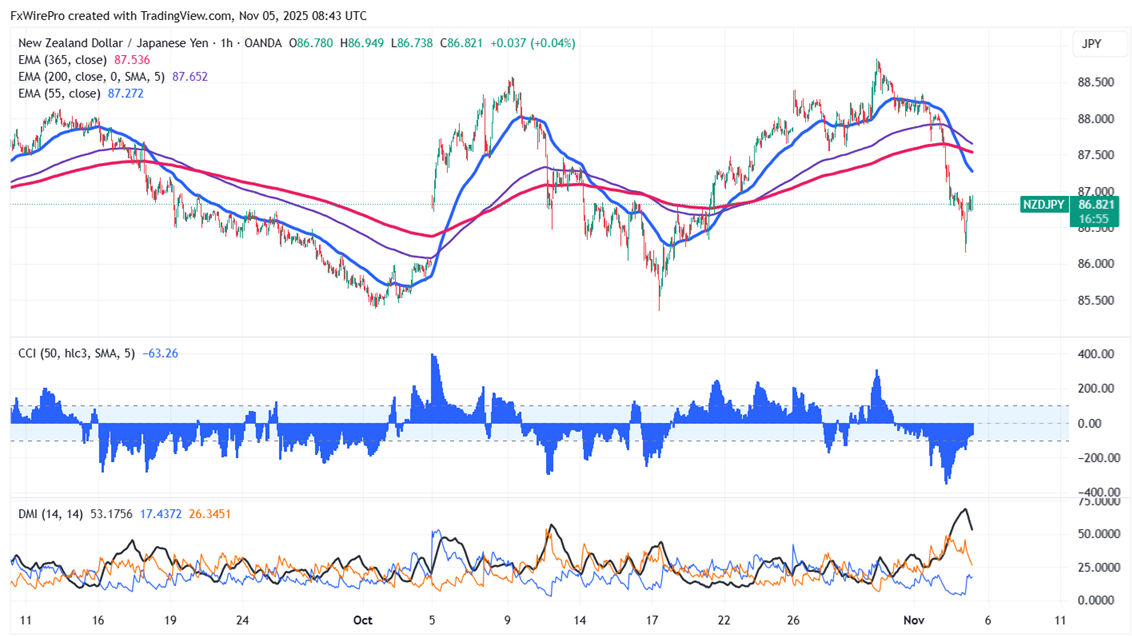
NZDJPY lost its shine on a weak New Zealand dollar. The intraday trend remains bearish as long as the 87.50 resistance holds. Having reached a low of 86.15 yesterday, it now trades around 86.846.
Oscillators and moving averages to forecast the trend of NZDJPY
CMP- 86.846
EMA (4-hour chart)
55-EMA- 87.28
200-EMA- 87.66
365-EMA- 87.53. The pair trades below the short and below long-term moving average.
Major support- 86. Any breach below will drag the pair down to 85.37/84.45/84.
Major resistance - 87. Any break above 87 confirms minor bullishness, a jump to 87.50/88.10/89.
Indicator (1 hour chart)
CCI (50)- bearish
Average directional movement Index- Neutral. All indicators confirm a mixed trend.
It is good to sell on rallies around 87 with SL around 87.50 for TP of 86/85.37.


