


 Gold Loses Steam After Strong U.S. Retail Sales
  NZDJPY Bullish Surge: Strong Kiwi Ignites Fresh Upside as 94 Support Holds and All EMAs Align
  GBPJPY Bullish Surge: Strong Pound Ignites Fresh Upside on Fed-BOE Policy Divergence as All EMAs Align
  FxWirePro- Woodies pivot (Major)
  FxWirePro: USD/JPY uptrend loses steam, remains on bullish path
  FxWirePro: USD/CAD falls after BoC rate hold and weak U.S. producer inflation
  FxWirePro- Major Pair levels and bias summary
  FxWirePro- Major Crypto levels and bias summary
  EUR/USD Holds Bullish Tone Despite Pullback from Yesterday’s High
  JPY Action Bias: Extremely Bullish Surge Ignites Across NZD, GBP & AUD
  FxWirePro: USD/ZAR advances as South African rand weakens amid renewed Middle East tensions
  FxWirePro:EUR/NZD dips below lower range, bearish bias increases
  ETH Stands Alone Bullish; BTC, SOL, XRP, BNB Neutral
  FxWirePro- Major Crypto levels and bias summary


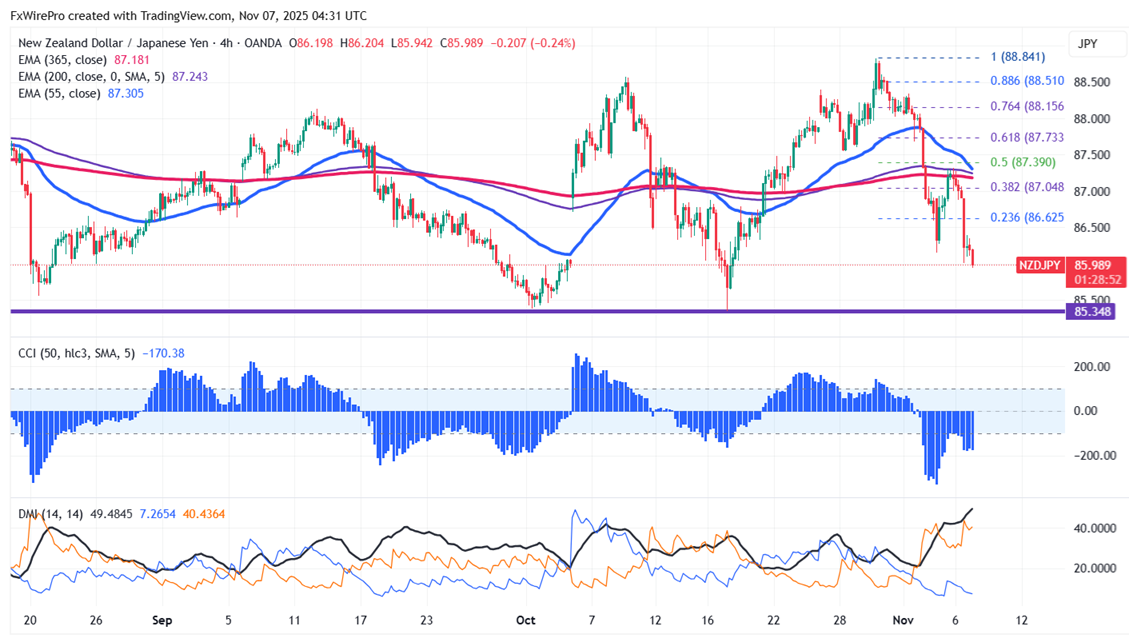
NZDJPY lost its shine on board-based New Zealand dollar selling. The intraday trend is bearish as long as the resistance at 87 holds. Having reached an intraday low of 85.94, it now trades around 86.01.
Oscillators and moving averages to forecast the trend of NZDJPY
CMP- 86.01
EMA (4-hour chart)
55-EMA- 87.35
200-EMA- 87.25
365-EMA- 87.18. The pair trades below the short (55 EMA) and long-term moving average .
Major support- 85.90. Any breach below will drag the pair down to 85.37/84.45/84.
Major resistance - 86.5. Any break above 86.65 confirms minor bullishness, a jump to 87/87.50/88.10/89.
Indicator (4 hour chart)
CCI (50)- bearish
Average directional movement Index- Bearish. All indicators confirm a bearish trend.
It is good to sell on rallies around 86.48-50 with SL around 87.10 for TP of 85.40/85.


