


 Silver Cracks Key 365-Day EMA for First Time Since Feb 2024; Bears Eye $50 on Rallies
  SpaceX Stock Gets $175 Target as Analysts See Massive Growth Ahead
  AI Memory Boom Sparks Global Chip Supply Crunch
  How Donald Trump has changed the way diplomacy is done
  Bank Regulation Rollbacks in the U.S. and UK Could Increase Financial Risks, Study Warns
  Gold's 365-Day EMA Streak Since Oct 2023 Faces Its First Real Test at $3,980 — Break or Bounce to $4,140?
  China’s AI Manufacturing Boom Masks Weak Consumer Economy, Citi Says


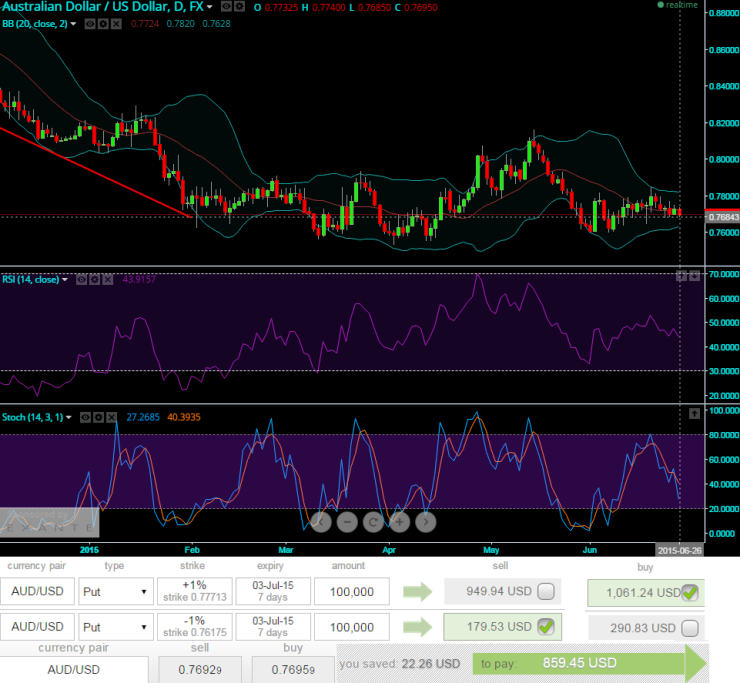
On daily charts of AUD/USD, RSI (14) evidences a falling price convergence at 43.8394; downward momentum has been observed from last a week or so.
Hanging man pattern candlestick occurred two days ago followed by long real body bear candle.
Selling pressure is mounting as the %D line crossover at 43.8260 on slow stochastic curve.
Overbought pressure seen as crossover of the MACD line below slower line on MACD.
The pair has declined to the lows of 0.7683 and is currently trading at 0.7692. As a whole the weaker trend is intact so far.
On upside any breach above 0.7720 will target 0.7810 or even 0.7825 levels.
Currency Option Roundup: AUD/USD
Buying binary puts of this pair may fetch around 25-30 pips with ease and instantly.
On short to medium term hedging grounds, we advocate bear put spreads with combined -0.45 delta and theta should be close to zero.
Buy (1%) In-The-Money -0.72 delta puts, simultaneously short (-1%) Out-Of-The-Money put with positive theta values.

- News

- Economy

- Central Banks
- Investing
- Research
- Roundups
- Digital Currency
- Insights
- Technical Analysis
- Technology
- Business
- Law
- Health
- Nature
- Fintech
- Science
- Topic
- Opinions
- ©Econometrics LLC . All Rights Reserved.
Oscillators signals weakness in Aussie dollar; deploy binary puts & bear spreads
Friday, June 26, 2015 11:02 AM UTC
Editor's Picks


- Market Data
Most Popular


