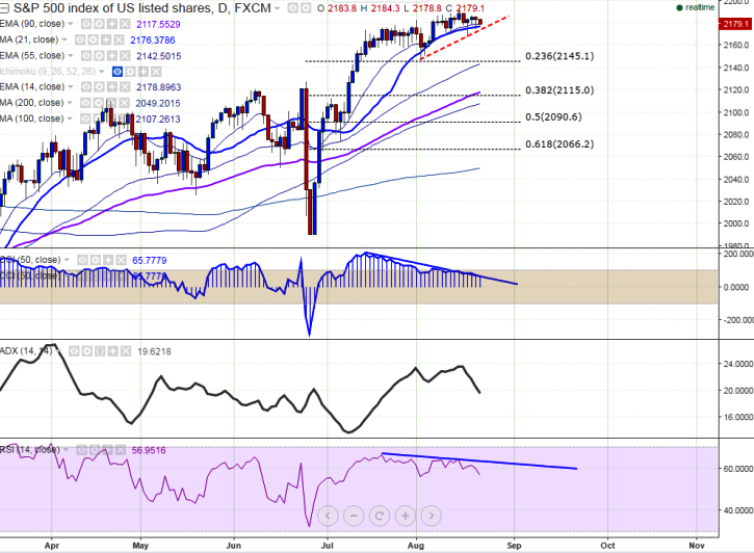
Major resistance- 2201 (161.8% retracement of 2120 and 1989). Major support -2172 (trend line joining 2147 and 2168). Pattern formed- Bearish Divergence (RSI and CCI(50). S&P500 has made a temporary top around 2193.90 (A…
Major resistance- 2201 (161.8% retracement of 2120 and 1989).
Major support -2172 (trend line joining 2147 and 2168).
Pattern formed- Bearish Divergence (RSI and CCI(50).
S&P500 has made a temporary top around 2193.90 (Aug 15th 2016 high) and declined from that level. It is currently trading around 2179.
On the lower side, major support is around 2170 and any violation below will drag the index down till 2140 (55 day EMA)/2115 (38.2% retracement of 1989 and 2193.70).
Any break above 2201 confirms minor bullishness and break above targets 2210 (161.8% retracement of 2193.90 and 2168)/2230.
Minor weakness can be seen below 2170 level.
It is good sell on rallies around 2185 with SL around 2201 for the TP of 2145/2118