
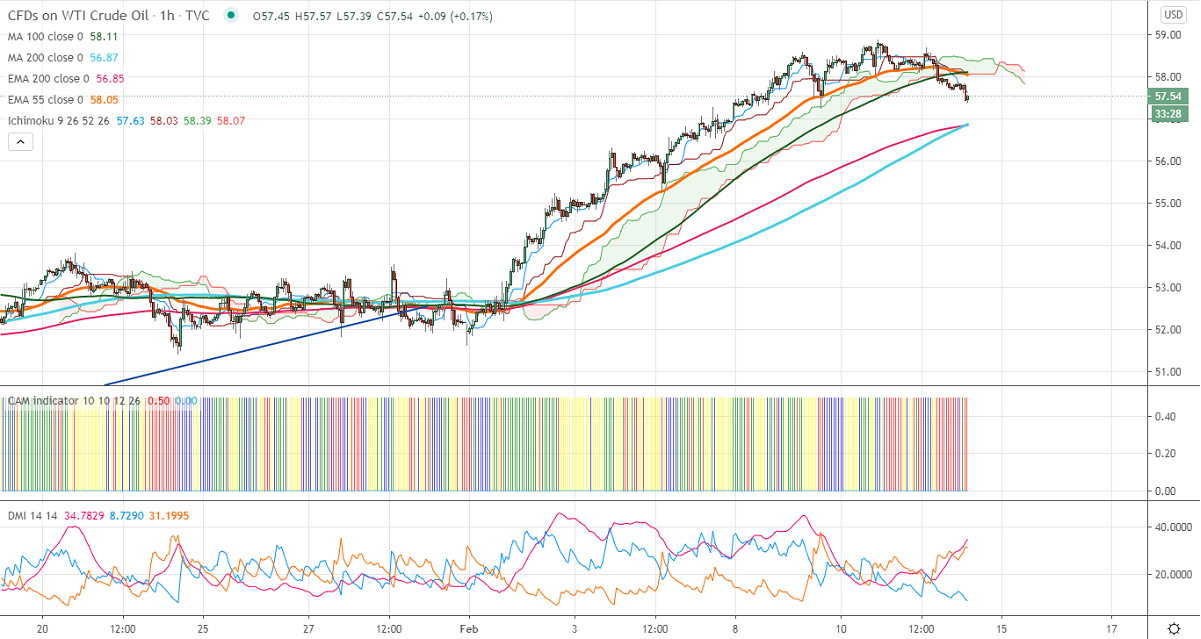
Ichimoku analysis (60 min chart)
Tenken-Sen- $58.24
Kijun-Sen- $57.91
US Oil has formed a major top near $58.88 and started to decline despite positive US inventory data. The hopes of more fiscal stimulus and corona vaccine rollout were the main reason for the jump in oil price in the past four months. The short term trend of oil is slightly bullish as long as support $53 holds. The intraday trend is on the weaker side, a dip to $56.80 is possible.
Economic data:
According to Energy Information Administration (EIA), US inventory has declined by 6.6 million barrels for the week ended Feb 5th compared to an estimate of -0.9M. EIA has raised price forecasts for 2021and 2022.
Technical:
In the hourly chart, US oil is trading well below the long-term moving average (100 MA) and Tenken-Sen, Kijun-Sen. Any break below $56.85 (200- MA) confirms bearish continuation, a decline till $55 is possible. On the higher side, near term intraday resistance is around $58.11 and any indicative break below that level will take the pair to $58.88/$60.
It is good to sell on rallies around $57.95-$58 with SL around $58.50 for the TP of $56.80/$55.


