


 FxWirePro: GBP/AUD drifts lower after BOE rate decision
  FxWirePro: GBP/NZD remains weak, eyes 38.2%fib support
  Major European Indices Score Extremely Bullish: DAX Eyes 26000, CAC Targets 8600, FTSE100 at 11000 – Key Levels to Watch
  FxWirePro: USD/CAD retreats after Canada posts stronger-than-expected GDP growth
  FxWirePro- Major Crypto levels and bias summary
  FxWirePro: NZD/USD consolidates overnight gains, but loses momentum
  FxWirePro- Major Crypto levels and bias summary
  FxWirePro: GBP/USD rises as soft US data pressures dollar
  FxWirePro- Major Pair levels and bias summary
  AUD/JPY Slips Below 112 as BOJ Intervention Sparks Bearish Momentum: Sell the Rallies
  Nikkei Surges Past 65,000 on Suspected Yen Weakness: Tech Giants Like Advantest and NEC Lead Explosive Gains
  US Magnificent 7 Stocks Trend Score: Amazon & Microsoft Hit Extreme Bullish (+100) as Meta Drops to -100 — Key Resistance & Support Watchlist
  Major FX Action Bias & US Market Sentiment: NZD/USD (Extremely Bullish) & AUD/USD (Bullish) Watchlist
  FxWirePro- Major Pair levels and bias summary
  FxWirePro: USD/ZAR gains as stronger dollar outweighs upbeat South Africa's trade surplus
  FxWirePro- Woodies pivot (Major)


Candlestick Pattern- Shooting Star (4 hours chart)
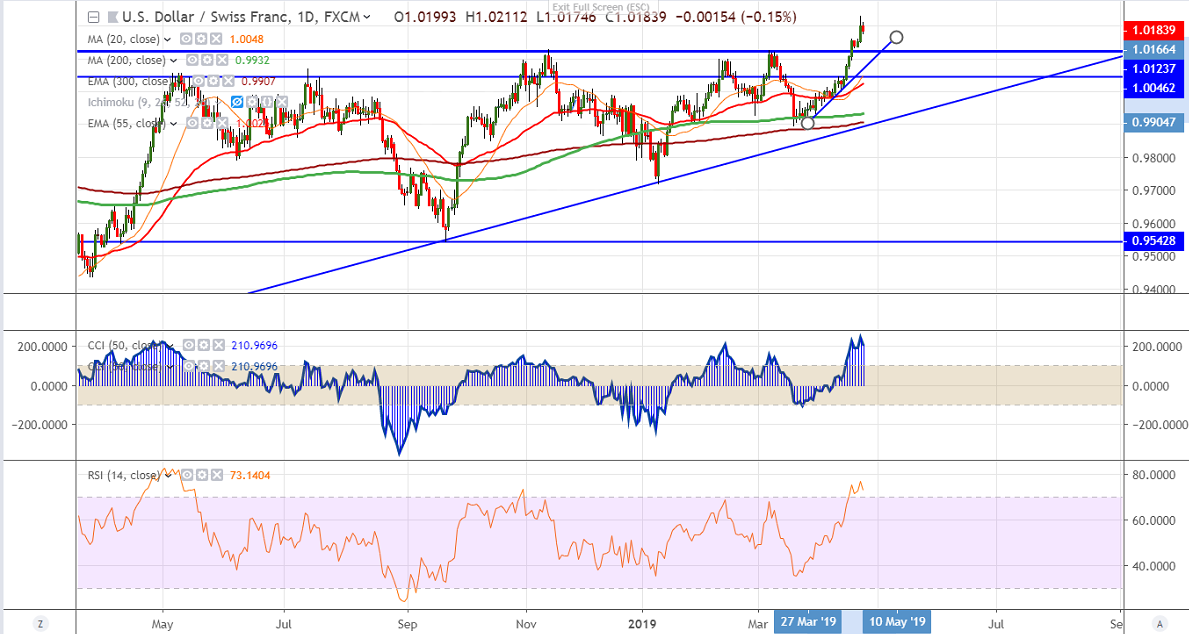
USDCHF trades lower after a massive jump of more than 200 pips in past 10 days on account of broad based US dollar buying and easing trade tension has decreased demand of safe haven assets. The pair hits high of 1.02305 and is currently trading around 1.01791.
The near term support is around 1.01660 (20- 4H MA) and any break below will take the pair to next level till 1.0125/1.0100.
The major resistance is around 1.02500 and any convincing break above targets 1.0300/1.03400.
The momentum indicator RSI in daily chart is around 75 indicates overbought and so minor decline cannot be ruled out.
It is good to sell on rallies around 1.0200 with SL around 1.02350 for the TP of 1.0125.


