


 FxWirePro:EUR/NZD dips below lower range, bearish bias increases
  FxWirePro: AUD/USD edges lower, but bullish outlook persists
  FxWirePro: USD/CAD falls after BoC rate hold and weak U.S. producer inflation
  FxWirePro: USD/JPY uptrend loses steam, remains on bullish path
  FxWirePro: AUD/USD remains buoyant, looks to extend gains
  AUDJPY Bullish Surge: Strong Australian Dollar Fuels Fresh Upside as Pair Holds Above 113.50 and All EMAs Align
  Gold Loses Steam After Strong U.S. Retail Sales
  Crypto Major Pair Action Bias: ETHUSD Bullish as BTCUSD, SOLUSD & XRPUSD Stay Neutral
  GBPJPY Bullish Surge: Strong Pound Ignites Fresh Upside on Fed-BOE Policy Divergence as All EMAs Align
  FxWirePro- Major Crypto levels and bias summary
  FxWirePro: NZD/USD steadies around 0.5830,retains bid tone
  FxWirePro :USD/JPY bulls loosen their grip a bit, dips to be bought
  FxWirePro: EUR/AUD outlook weaker on renewed downside pressure
  NZDJPY Bullish Surge: Strong Kiwi Ignites Fresh Upside as 94 Support Holds and All EMAs Align


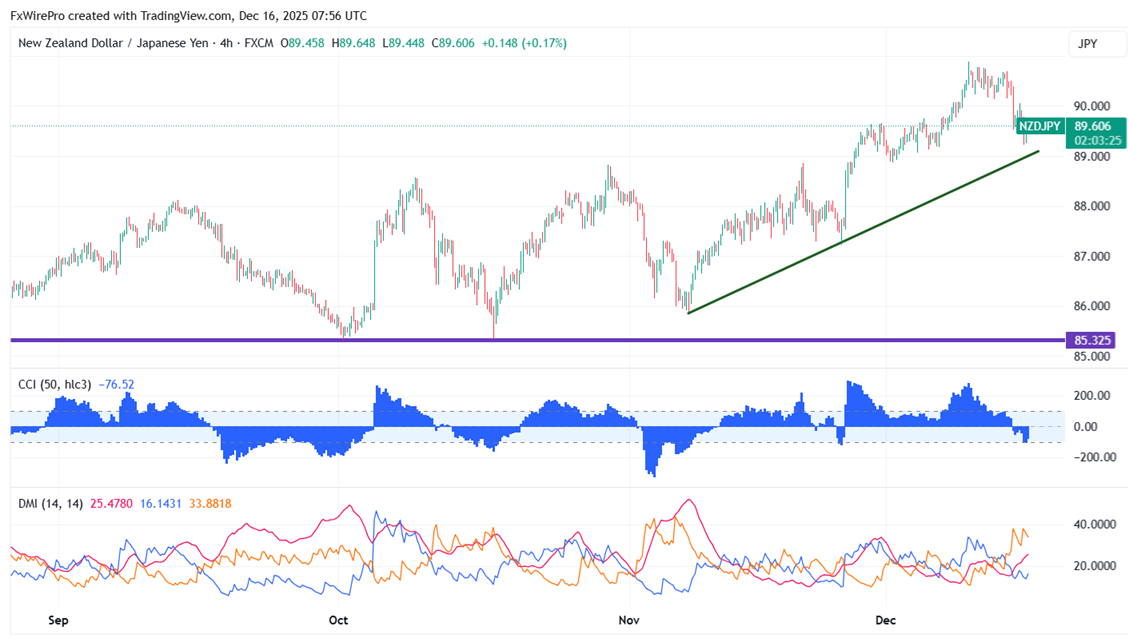
NZDJPY lost its shine on board-based yen buying. The intraday trend is bearish as long as resistance at 91 lasts. The pair reached an intraday low of 89.22; it presently trades around 89.56.
Oscillators and moving averages to forecast the trend of NZDJPY
CMP- 89.56
EMA (1-hour chart)
55-EMA- 90.40
200-EMA- 88.81
365-EMA- 88.23. The pair trades above the short (55 EMA) and long-term moving average(200 and 365).
Major support- 89.20. Any breach below will drag the pair down to 88.70/88.40/87.99/87.20/86.65/85.37/85.
Major resistance - 90. Any break above 90 confirms minor bullishness, a jump to 90.60/91.39/92.
Indicator (4-hour chart)
CCI (50)- bearish
Average directional movement Index- Bearish. All indicators confirm a bearish trend.
It is good to sell on rallies around 90 with SL around 91 for TP of 88.


