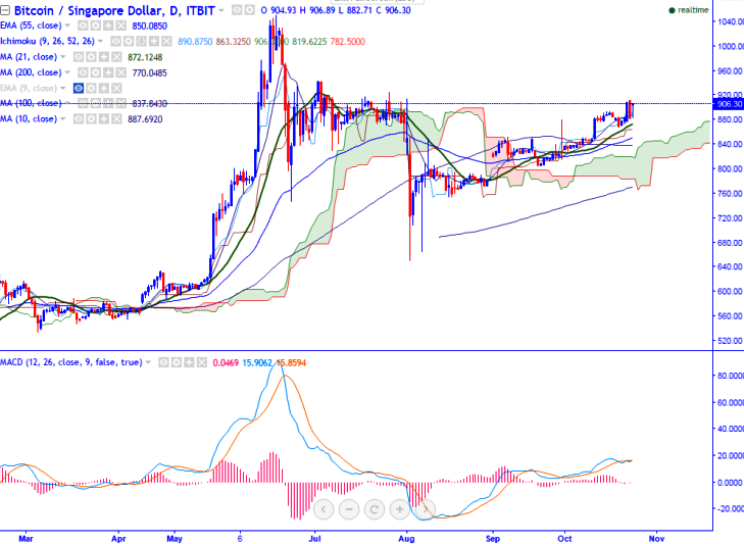
BTC/SGD trades above 61.8% fibo, jump till 925 likely
BTC/SGD is seen trading slightly above on Monday after the major plunge. The pair has broken the high 893.66 made on Oct 15th, 2016 high and jumped till 909.66 levels (ITBIT). It is currently trading around 905.72 at the…
BTC/SGD is seen trading slightly above on Monday after the major plunge. The pair has broken the high 893.66 made on Oct 15th, 2016 high and jumped till 909.66 levels (ITBIT). It is currently trading around 905.72 at the time of writing.
Ichimoku analysis of daily chart shows:
Tenkan-Sen level: 881.63
Kijun-Sen level: 837.85
Trend reversal level - (100 days MA) – 840.98
Long-term trend remains to be bullish. The pair struggles to close below 10- day MA and any minor weakness can be seen only below that level.
Major resistance is around 897 (61.8% retracement of 1051.24 and 650) and any violation above will take the pair till 925 (Jul 26th high)/944 (Jul 2nd, 2016 high). Short-term support is seen at 882 (23.6% retracement of 805.01 and 909.66) and any break below targets 869.80 (21- day MA)/ 848 (55- day EMA).