FxWirePro: BTC/GBP takes support near 21-DMA, good to buy on dips
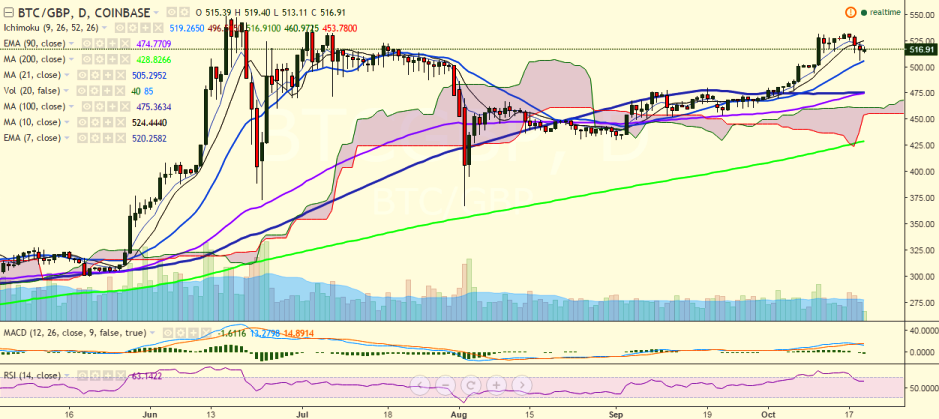
BTC/GBP declined till 505.84 levels on Wednesday before closing at 516.58 levels. Today, the pair is trying to hold its upward strength and is trading at 516.81 levels currently (Coinbase). Long-term trend: Bullish Ichim…
BTC/GBP declined till 505.84 levels on Wednesday before closing at 516.58 levels. Today, the pair is trying to hold its upward strength and is trading at 516.81 levels currently (Coinbase).
Long-term trend: Bullish
Ichimoku analysis of daily chart:
Tenkan Sen: 516.93
Kijun Sen: 496.50
Trend reversal: 473.82 (90 EMA)
The pair will run into resistance at 522.99 (10-day MA) and break above would see it testing 532.69 (October 16 high)/ 544.88 (161.8% retracement of 532.69 and 512.96).
On the downside, support is seen at 503 (21-day MA) and any violation would drag the pair to 483.75 (61.8% retracement of 453.50 and 532.69)/475.27 (100-day MA).