


 Nvidia, ByteDance, and the U.S.-China AI Chip Standoff Over H200 Exports
  Dollar Near Two-Week High as Stock Rout, AI Concerns and Global Events Drive Market Volatility
  South Africa Eyes ECB Repo Lines as Inflation Eases and Rate Cuts Loom
  Rio Tinto Shares Hit Record High After Ending Glencore Merger Talks
  Washington Post Publisher Will Lewis Steps Down After Layoffs
  Weight-Loss Drug Ads Take Over the Super Bowl as Pharma Embraces Direct-to-Consumer Marketing
  Once Upon a Farm Raises Nearly $198 Million in IPO, Valued at Over $724 Million
  Samsung Electronics Shares Jump on HBM4 Mass Production Report
  Asian Stocks Slip as Tech Rout Deepens, Japan Steadies Ahead of Election
  American Airlines CEO to Meet Pilots Union Amid Storm Response and Financial Concerns
  Sony Q3 Profit Jumps on Gaming and Image Sensors, Full-Year Outlook Raised
  Kroger Set to Name Former Walmart Executive Greg Foran as Next CEO
  India–U.S. Interim Trade Pact Cuts Auto Tariffs but Leaves Tesla Out
  China Extends Gold Buying Streak as Reserves Surge Despite Volatile Prices
  Missouri Judge Dismisses Lawsuit Challenging Starbucks’ Diversity and Inclusion Policies
  Hims & Hers Halts Compounded Semaglutide Pill After FDA Warning
  Trump Lifts 25% Tariff on Indian Goods in Strategic U.S.–India Trade and Energy Deal


When the COVID-19 pandemic first hit, it seemed like the day of reckoning for over-stretched corporate borrowers was finally at hand. For years, pundits and policymakers had been warning about a dangerous build-up of the debt of “non-financial firms”, meaning all those that aren’t in finance, insurance or property.
According to an OECD report frmo 2019, their debt doubled globally in the decade following the crash of 2008-09. Surely the devastation wrought by a global pandemic would be enough to pop this giant bubble, setting off a wave of corporate defaults and putting the global financial system at risk of another major crisis?
Though corporate default rates climbed across the world in 2020, the long-anticipated collapse of the corporate debt market has not come to pass – at least not yet. This is thanks to government intervention, especially the unprecedented moves by central banks, including the Bank of England, to keep the interest rates on corporate bonds low by directly purchasing them.
These aggressive measures may have helped to avert a corporate debt catastrophe, but they’ve come at a hefty price. In 2020, global corporate debt issuance reached record highs, stoking fears that central banks have merely delayed the inevitable.
Central banks to the rescue?
The measures also appear to be fuelling a “K-shaped recovery” from the pandemic, as large corporations revive and their smaller counterparts keep falling. This is because central bank purchases have been heavily biased toward investment-grade debt, which is issued by large companies with more robust balance sheets.

K for kleptocracy? SewCream
This has meant that corporate giants have been borrowing vast amounts at record low costs, while their smaller counterparts have struggled to raise funds to see them through the pandemic. With these dynamics at play, it seems almost certain that in the post-COVID world there will be an increase in corporate concentration as more small players get absorbed by the giants.
Yet signs of a K-shaped recovery are less surprising than most people probably realise. The economy has in fact been K-shaped for decades. As our new research on the US shows, the financial fortunes of large corporations have been steadily improving since the early 1980s, while many smaller corporations have fallen into acute financial distress. The pandemic, in other words, is intensifying longstanding dysfunctionalities in US capitalism. The very idea of a K-shaped recovery obscures this reality.
The K-shaped recovery in context
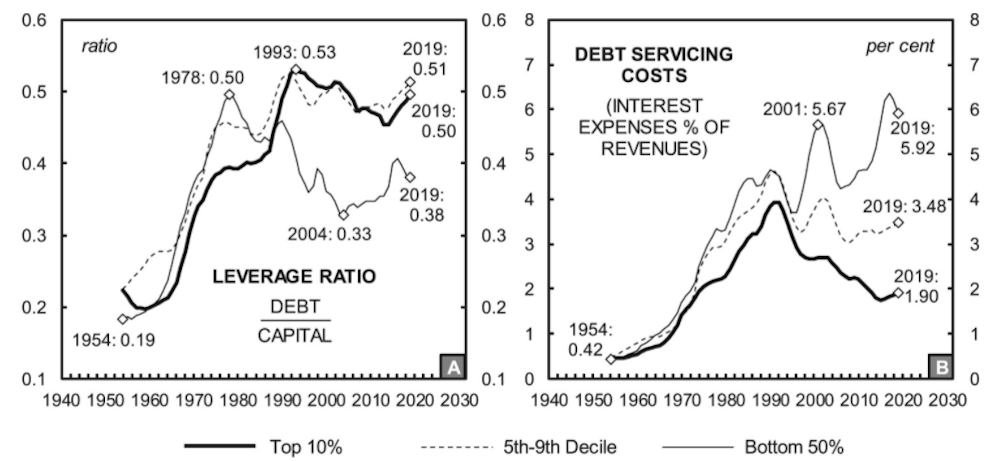
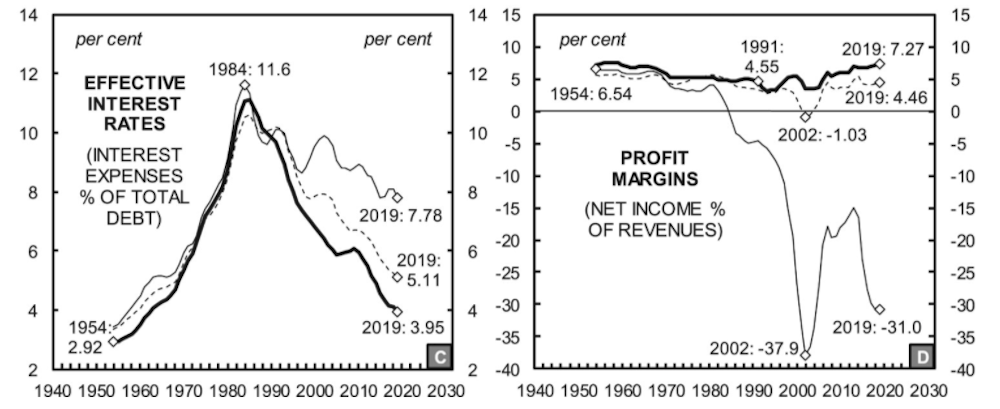
The situation can be seen in the graphs below. Based on US non-financial corporations listed on the stock market from 1954 to 2019, they map their leverage ratios (debt as a proportion of capital), debt-servicing costs, the interest rates they are effectively paying, and net profit margins. The lines in each graph represent the top 10% (in bold), the next 40% (in dashes) and the bottom 50% (in plain black) of corporations based on their revenues.
We see that the borrowing levels (leverage) of the top 10% have increased since the mid-1980s, while their debt servicing costs and effective interest rates fell. In line with these fortuitous borrowing conditions, the profit margins of large corporations doubled from just over 3.1% in the early-1990s to 7.3% in 2019.
Sandy Hager/Joseph Baines/New Political Economy
What’s astonishing is that the bottom 50% reduced their borrowing over roughly the same period, but their debt servicing costs increased. Over this time, smaller corporations saw their profit margins dip consistently into negative territory. The decades-long fall in interest rates appears to be the only thing that has kept smaller corporations afloat.
Smaller corporations thus appear to be caught in a vicious circle. The fact that their debt-servicing burdens have increased sharply despite deleveraging and falling interest rates points toward rapidly deteriorating financial fortunes. This is reaffirmed by the severe losses registered in their negative profit margins.
Smaller corporations might have been tempted to take advantage of falling interest rates on borrowing to increase their revenues and profits. But the cost of borrowing for smaller firms has been considerably higher than for medium-sized and large corporations, putting them at a considerable disadvantage.
For large corporations, on the other hand, the circle is virtuous: high and stable profit margins allow them to issue investment-grade bonds and borrow from banks at low interest rates, which, in turn, reinforce high and stable profit margins.
Shareholder capitalism
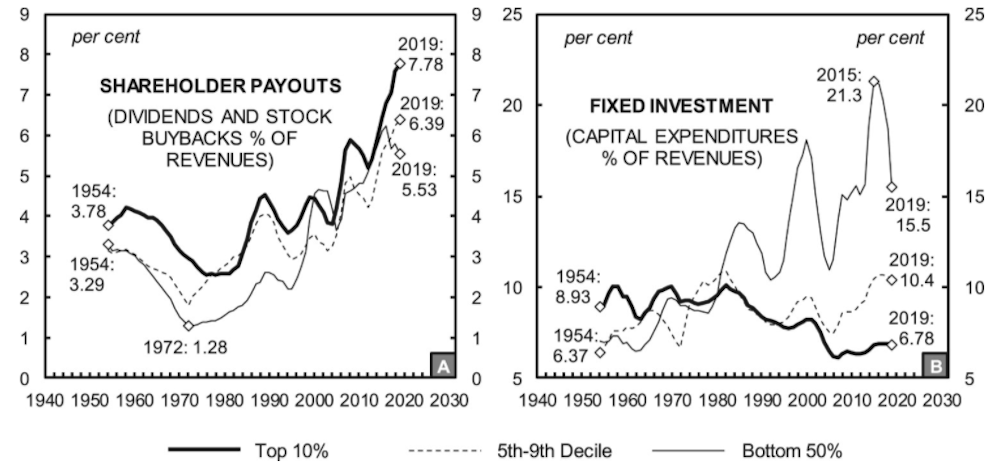
How did we end up in this situation? To address this question, we have to take into account the peculiar dynamics of shareholder capitalism as they have evolved in recent decades. The graphs below chart shareholder payouts and fixed investment as a proportion of revenues for our sample of US non-financial corporations – again with three different lines representing the top 10%, the next 40% and the bottom 50% of corporations.
Sandy Hager/Joseph Baines/New Political Economy
This shows that, in recent decades, corporations of all sizes have been under pressure from financial markets to increase payouts to shareholders in the form of dividends and stock buybacks. But many of the largest firms enjoy such a dominant position in the economy that they can return vast sums to shareholders without engaging in the large-scale investments that may lead to long-term employment and wage growth.
Corporations in the bottom 50% also have to appease shareholders who are continually demanding higher returns on their investments, but unlike large firms they additionally have to establish themselves through large-scale capital investment. This dual imperative puts them in a very precarious position.
So while we may be witnessing a K-shaped recovery from COVID-19, it’s important to keep in mind that this K-shape has a much longer history. Though more research is needed, there are signs that this K-shape has also characterised many other advanced economies in the lead-up to the pandemic, including the UK.
In our view, the pandemic represents a missed opportunity for policymakers. Rather than use their fiscal and monetary power to build a more stable and equitable financial system, central banks instead have chosen to prop up a highly dysfunctional one.
Unless there is a radical departure from the current policy regime, the post-COVID 19 world is likely to resemble the pre-COVID 19 one, only with more market turmoil because of the precarious position of smaller companies, more concentration, and even less investment.


