


 Bitcoin on Edge: Geopolitical Tensions Weigh on BTC as Bulls Eye the USD 64,000 "Buy the Dip" Zone
  Bitcoin Battles Volatility: Institutional Support Eyes USD 64,000 Floor Amid Geopolitical Tensions
  Bitcoin’s High-Stakes Volatility: BTCUSD Navigates Geopolitical Storms
  FxWirePro: AUD/USD downside pressure builds, key support level in focus
  Ethereum in Consolidation: ETH Trapped in Narrow Range as Bulls Await the USD 2,000 "Buy the Dip" Opportunity
  FxWirePro: EUR/AUD eases slightly but trend is still bullish
  FxWirePro: EUR/ NZD consolidating around 2.0180 room for further gains
  FxWirePro- Major Pair levels and bias summary
  FxWirePro: GBP/NZD remains buoyant, looks to extend gains
  FxWirePro- Woodies Pivot(Major)


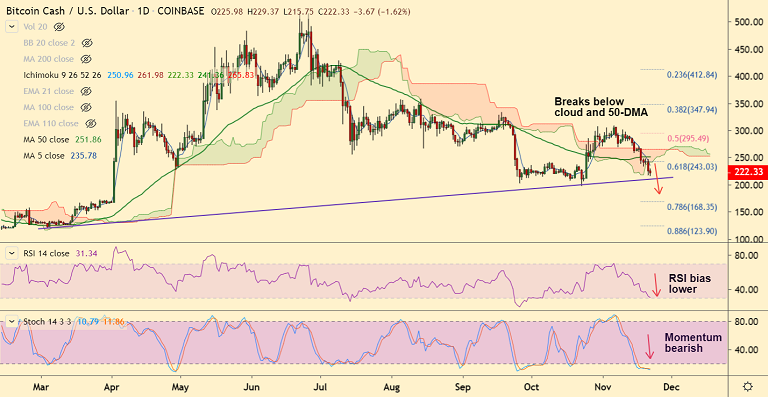
BCH/USD chart - Trading View
Exchange - Coinbase
Support: 209.75 (Trendline); Resistance: 236.32 (5-DMA)
Technical Analysis: Bias Bearish
BCH/USD edges higher from session lows at 215.75, bias strongly bearish.
The pair is extending weakness below daily cloud, is on track to test trendline support at 209.75.
Technical indicators are strongly bearish. Oscillators are at oversold, but no signs of reversal seen
The pair is extending downside for the 2nd straight week after Doji formation at highs on the weekly chart.
Violation at trendline support at 209.75 is likely to plummet prices further, drag till 78.6% Fib at 168.35 likely.
5-DMA is immediate resistance at 235.92. Bounce off trendline support and break above 5-DMA could see gains till 50-DMA at 251.87.


