


 FxWirePro- Major Crypto levels and bias summary
  FxWirePro: USD/ZAR fibo rejection triggers sizeable pullback
  Ethereum Rises on Geopolitical De-escalation: Pezeshkian’s Peace Signal Ignites Bullish Momentum
  FxWirePro- Major Crypto levels and bias summary
  Bitcoin Battles Volatility: Institutional Support Eyes USD 64,000 Floor Amid Geopolitical Tensions
  Bitcoin Recovers Amid Easing Geopolitics: Bulls Target USD 80,000 Support Rebound
  FxWirePro- Major Crypto levels and bias summary
  FxWirePro- Woodies Pivot(Major)
  EUR/JPY Bulls Charge: Eyeing 186.00 as Euro Strength Intensifies
  FxWirePro: AUD/USD downside pressure builds, key support level in focus


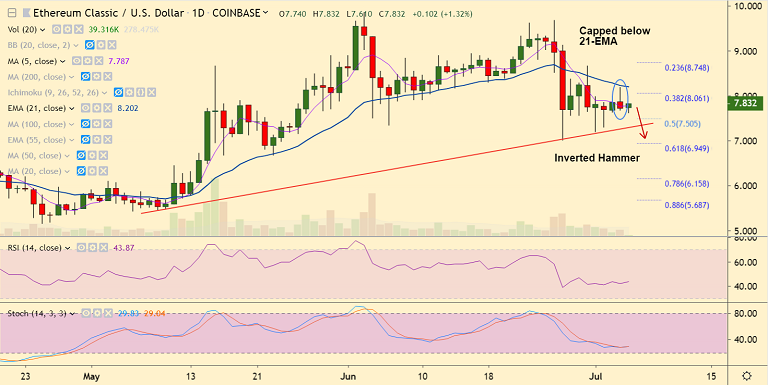
ETC/USD chart - Trading View
Exchange - Coinbase
Support: 7.30 (trendline); Resistance: 8.20 (21-EMA)
Technical Analysis: Bias Neutral to slightly bearish
Ethereum Classic is extending sideways, scope for downside.
ETC/USD was trading at 7.799 at 10:45 GMT, up 0.91% at the time of writing.
Technical studies are tilting towards a bearish bias, price action remains capped below 21-EMA.
A bearish 'Inverted Hammer' formation on Thursday's candle raises scope for weakness.
RSI is well below 50 level and Stochs show bearish momentum. Dip till trendline support at 7.30 likely.
Violation at trendline support will accentuate downside. Next major supports lie at 6.95 (61.8% Fib) and then 6.67 (May 23 low).
Decisive break above 21-EMA could negate near-term bearishness.
For details on FxWirePro's Currency Strength Index, visit http://www.fxwirepro.com/currencyindex.


