


 FxWirePro- Major Pair levels and bias summary
  Ethereum Retreats Toward USD 2,000: Technicals Signal Caution as ETH Mimics Bitcoin’s Pullback
  FxWirePro: AUD/USD downside pressure builds, key support level in focus
  Bitcoin Recovers Amid Easing Geopolitics: Bulls Target USD 80,000 Support Rebound
  Bitcoin on Edge: Geopolitical Tensions Weigh on BTC as Bulls Eye the USD 64,000 "Buy the Dip" Zone
  Bitcoin Battles Volatility: Institutional Support Eyes USD 64,000 Floor Amid Geopolitical Tensions
  FxWirePro- Major Crypto levels and bias summary
  FxWirePro- Major Crypto levels and bias summary
  FxWirePro:NZD/USD drifts lower, could be on verge of bigger drop
  Ethereum Rises on Geopolitical De-escalation: Pezeshkian’s Peace Signal Ignites Bullish Momentum
  FxWirePro- Major European Indices


ETH/USD chart - Trading View
Exchange - Coinbase
Major Support Levels:
S1: 207.41 (200-DMA)
S2: 200.96 (55-EMA)
S3: 198.26 (21-EMA)
Major Resistance Levels:
R1: 214.80 (5-DMA)
R2: 226.75 (100-DMA)
R3: 240.2 (38.2% Fib)
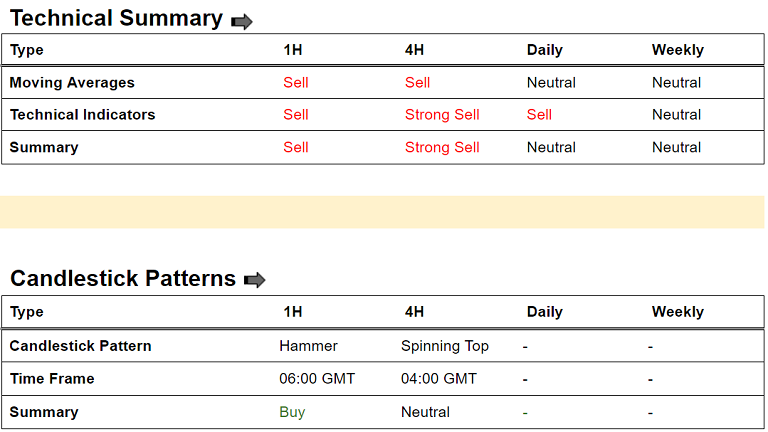
Summary: ETH/USD retraces from 6-week highs at 224.71 and is currently hovering around 200-DMA support at 207.41. Break below 200-DMA will see further weakness. Technical indicators on the intraday are turning bearish. Stochs and RSI are on verge of rollover from overbought levels. Major trend is bearish, break below 200-DMA will drag the pair lower. Bullish divergence could limit downside.
Guidance: Stay short on break below 200-DMA, target-1: 200, target-2: 198.50


