


 FxWirePro- Major Crypto levels and bias summary
  FxWirePro- Major Crypto levels and bias summary
  FxWirePro: GBP/NZD remains buoyant, looks to extend gains
  FxWirePro: USD/CAD runs out of steam but maintains bullish outlook
  FxWirePro: USD/JPY firms as Trump's address on Gulf war spark fresh concerns
  FxWirePro- Major Crypto levels and bias summary
  FxWirePro- Woodies Pivot(Major)
  NZDJPY Bears Take Control: New Zealand Dollar Retreats as 92 Resistance Holds Firm
  Ethereum Rises on Geopolitical De-escalation: Pezeshkian’s Peace Signal Ignites Bullish Momentum
  Ethereum in Consolidation: ETH Trapped in Narrow Range as Bulls Await the USD 2,000 "Buy the Dip" Opportunity
  FxWirePro:NZD/USD drifts lower, could be on verge of bigger drop


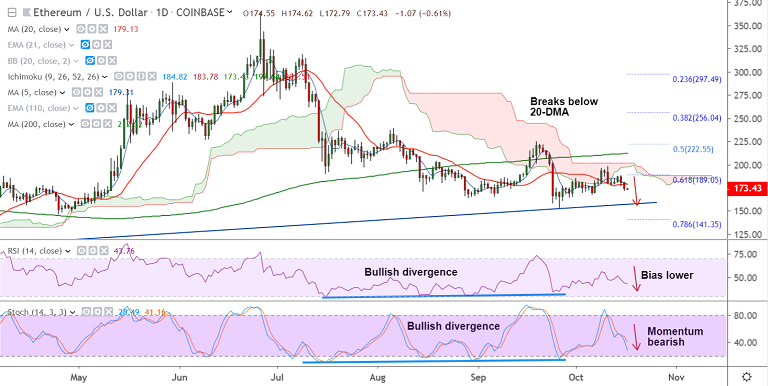
ETH/USD chart - Trading View
Exchange - Coinbase
Support: 167.50 (Oct 6 low); Resistance: 179 (converged 5 and 20 DMAs)
Technical Analysis: Bias Bearish
ETH/USD is set to resume weakness after previous session's slump, technical bias bearish.
The pair was trading 0.62% lower on the day at 173.42 after closing 3.37% lower on Wednesday's trade.
Price action has broken below 20-DMA support and is now on track to test Oct 6th lows at 167.50.
Major trend has been bearish, minor trend has also shifted to bearish as indicated by turn in short-term MA on GMMA indicator.
Bullish divergence could limit downside. Also Stochastics oscillator on weekly charts has approached oversold zone.
Next major support below 167.50 (Oct 6 low) lies at 158 (trendline). Breach below trendline support will see test of 78.6% Fib at 141.35.
Strong resistance is seen at 179 (converged 5 and 20 DMAs). Bearish invalidation only above 200-DMA.


