


 FxWirePro: USD/JPY firms as Trump's address on Gulf war spark fresh concerns
  Pound Under Pressure as Yen Stabilizes: GBPJPY Bears Target 208 as Key EMAs Hold Resistance
  FxWirePro- Major European Indices
  FxWirePro- Major Crypto levels and bias summary
  Ethereum Retreats Toward USD 2,000: Technicals Signal Caution as ETH Mimics Bitcoin’s Pullback
  FxWirePro- Major Pair levels and bias summary
  FxWirePro: GBP/NZD remains buoyant, looks to extend gains
  FxWirePro- Major Crypto levels and bias summary
  Ethereum in Consolidation: ETH Trapped in Narrow Range as Bulls Await the USD 2,000 "Buy the Dip" Opportunity
  FxWirePro: USD/CNY gains some ground but bearish outlook persists
  Euro Retreats as Geopolitical Tensions Surge: EURUSD Eyes 1.1400 Floor Amid Safe-Haven Demand


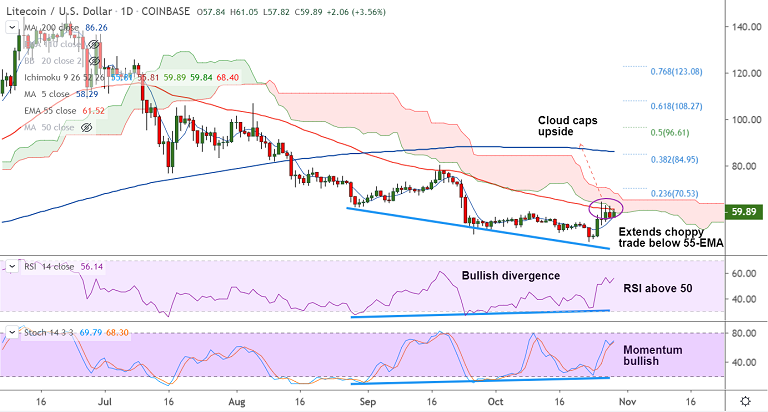
LTC/USD chart - Trading View
Exchange - Coinbase
Support: 56.32 (21-EMA); Resistance: 61.52 (55-EMA)
Technical Analysis: Turning slightly bullish
Litecoin is extending choppy trade below 55-EMA resistance (currently at 61.52).
The pair has bounced off major trendline support and breakout at 55-EMA will see upside continuation.
Volatility is rising as evidenced by expanding Bollinger bands. Technical indicators support gains.
Stochs and RSI are biased higher and 'Bullish Divergence' adds to the upside bias.
GMMA indicator shows major trend remains bearish. But, there is a shift in near-term trend to bullish.
Break above 55-EMA and cloud finds next major hurdle at 23.6% Fib at 70.53. Further bullishness could see test of 200-DMA at 86.26.
21-EMA at 56.32 is strong support. Retrace below will see downside resumption.


