


 Wall Street Analysts Weigh in on Latest NFP Data
  FxWirePro: USD/ZAR fibo rejection triggers sizeable pullback
  FxWirePro: GBP/NZD remains buoyant, looks to extend gains
  FxWirePro: EUR/AUD eases slightly but trend is still bullish
  U.S. Stocks vs. Bonds: Are Diverging Valuations Signaling a Shift?
  Bitcoin Battles Volatility: Institutional Support Eyes USD 64,000 Floor Amid Geopolitical Tensions
  FxWirePro: GBP/USD outlook weaker on renewed downside pressure
  Gold Prices Slide as Rate Cut Prospects Diminish; Copper Gains on China Stimulus Hopes
  FxWirePro: USD/ZAR sustains gains as uptrend remains strong
  Ethereum Retreats Toward USD 2,000: Technicals Signal Caution as ETH Mimics Bitcoin’s Pullback
  UBS Projects Mixed Market Outlook for 2025 Amid Trump Policy Uncertainty
  Goldman Predicts 50% Odds of 10% U.S. Tariff on Copper by Q1 Close
  Energy Sector Outlook 2025: AI's Role and Market Dynamics
  FxWirePro: USD/JPY firms as Trump's address on Gulf war spark fresh concerns
  China’s Growth Faces Structural Challenges Amid Doubts Over Data
  FxWirePro:NZD/USD drifts lower, could be on verge of bigger drop
  Urban studies: Doing research when every city is different


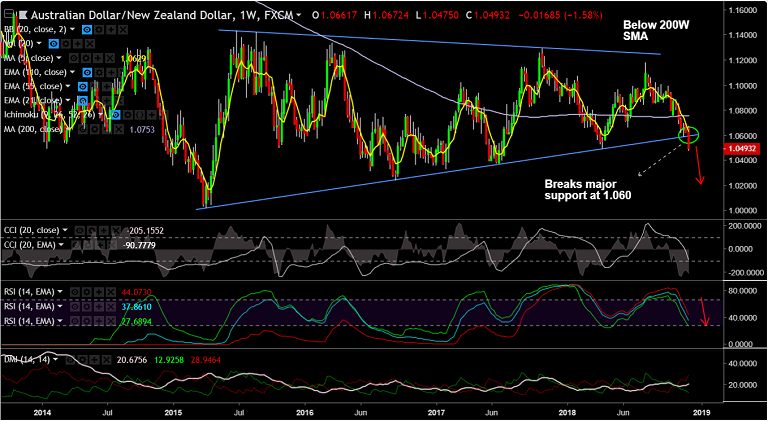
AUD/NZD chart on Trading View used for analysis
- AUD/NZD has broken "Symmetric Triangle" pattern, raising scope for further downside.
- The pair is extending weakness for the 6th straight session and hit 15-month lows at 1.0475.
- Breach at 'Triangle Base' support at 1.06 has opened up downside for the pair.
- Technicals support further weakness, drag till 1.0370 (Jun 2017 low) now likely.
- Technical indicators on weekly charts are also bearish. Stochs and RSI sharply lower.
- MACD supports downside. We see -ve DMI dominance and ADX rising in support of weakness.
- Price has slipped below weekly cloud and 200-W SMA and we see bearish invalidation only on retrace above.
Call update: Our previous call (https://www.econotimes.com/FxWirePro-AUD-NZD-Near-Term-Outlook-1467221) has hit targets.
Recommendation: Book partial profits, stay short for further downside. Target 1.0370.
For details on FxWirePro's Currency Strength Index, visit http://www.fxwirepro.com/currencyindex.


