


 FxWirePro: USD/JPY firms as Trump's address on Gulf war spark fresh concerns
  FxWirePro: USD/ZAR sustains gains as uptrend remains strong
  Fed May Resume Rate Hikes: BofA Analysts Outline Key Scenarios
  FxWirePro: USD/CAD runs out of steam but maintains bullish outlook
  U.S. Banks Report Strong Q4 Profits Amid Investment Banking Surge
  U.S. Stocks vs. Bonds: Are Diverging Valuations Signaling a Shift?
  2025 Market Outlook: Key January Events to Watch
  UBS Projects Mixed Market Outlook for 2025 Amid Trump Policy Uncertainty
  Gold Prices Fall Amid Rate Jitters; Copper Steady as China Stimulus Eyed
  FxWirePro: EUR/AUD gaining momentum for a move towards 1.6800 level
  S&P 500 Relies on Tech for Growth in Q4 2024, Says Barclays
  Oil Prices Dip Slightly Amid Focus on Russian Sanctions and U.S. Inflation Data
  FxWirePro: GBP/NZD range to extend until there is game changing news
  EUR/JPY Bulls Charge: Eyeing 186.00 as Euro Strength Intensifies
  FxWirePro: GBP/USD recovers but bears are not done yet again
  FxWirePro: USD/ZAR fibo rejection triggers sizeable pullback
  US Futures Rise as Investors Eye Earnings, Inflation Data, and Wildfire Impacts


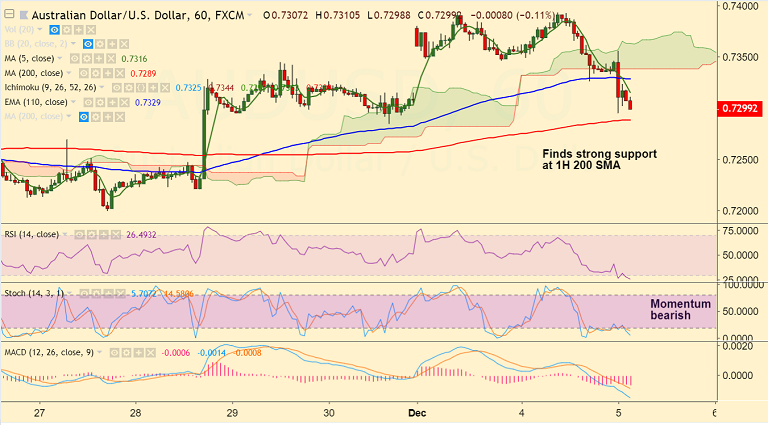
AUD/USD chart on Trading View used for analysis
- AUD/USD has resumed downside after a brief pause, bulls dented by dismal Australia Q3 GDP data.
- Australia September quarter GDP arrived well below estimates, supporting the view that RBA will keep rates unchanged through 2019.
- The pair edged slightly higher as a big beat on the Chinese Caixin November services PMI offered some reprieve to the Aussie bulls.
- China Caixin/Markit Nov Services PMI hit a 5-month high of 53.8 versus Oct’s 50.8 and beating estimates at 50.8, led by the rise in new orders.
- However, markets seems to have brushed aside upbeat China data and the major has resumed declie.
- We see strong support at 1H 200 SMA at 0.7289. Violation there could see further weakness.
- On the flipside, the pair has slipped below 5-DMA and retrace above could see gains upto 200-DMA.
Support levels - 0.7289 (1H 200-SMA), 0.7279 (110-EMA), 0.7266 (20-DMA)
Resistance levels - 0.7322 (5-DMA), 0.7363 (Upper BB), 0.7412 (200-DMA)
For details on FxWirePro's Currency Strength Index, visit http://www.fxwirepro.com/currencyindex.


