


AUD/USD chart - Trading View
Technical Analysis: Bias Bullish
GMMA Indicator
- Major trend is turning bullish, while minor trend is strongly bullish
Ichimoku Analysis
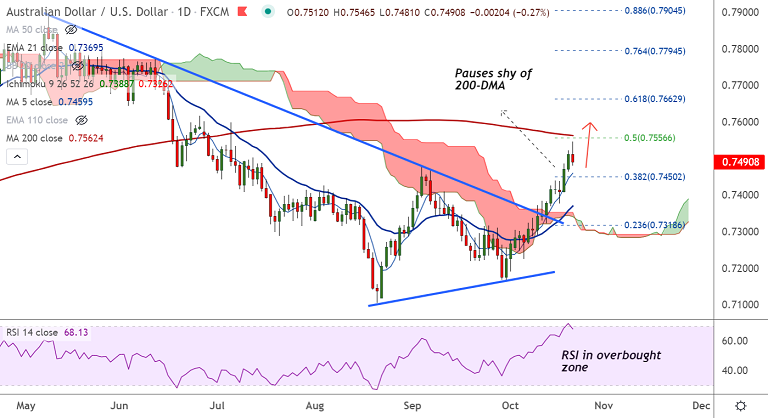
- Price action is above daily cloud, but Chikou span is biased lower
Oscillators
- Stochs and RSI show bullish momentum
- Overbought conditions warrant some caution
Bollinger Bands
- Bollinger bands are spread wide apart showing high volatility
Major Support Levels: 0.7459 (5-DMA), 0.7411 (110-EMA), 0.7369 (21-EMA)
Major Resistance Levels: 0.7562 (200-DMA), 0.76, 0.7662 (61.8% Fib)
Summary: AUD/USD trades with a strong bullish momentum. Price action has approached crucial resistance at 200-DMA at 0.7562. Decisive break above required for upside continuation.
Overbought oscillators warrant some caution. However, major trend is bullish and pullbacks are likely to be shallow. Bullish invalidation only below daily cloud.


