


 UBS Predicts Potential Fed Rate Cut Amid Strong US Economic Data
  U.S. Treasury Yields Expected to Decline Amid Cooling Economic Pressures
  Bank of America Posts Strong Q4 2024 Results, Shares Rise
  Indonesia Surprises Markets with Interest Rate Cut Amid Currency Pressure
  U.S. Banks Report Strong Q4 Profits Amid Investment Banking Surge
  Goldman Predicts 50% Odds of 10% U.S. Tariff on Copper by Q1 Close
  S&P 500 Relies on Tech for Growth in Q4 2024, Says Barclays
  European Stocks Rally on Chinese Growth and Mining Merger Speculation
  China's Refining Industry Faces Major Shakeup Amid Challenges
  2025 Market Outlook: Key January Events to Watch
  Gold Prices Slide as Rate Cut Prospects Diminish; Copper Gains on China Stimulus Hopes
  China’s Growth Faces Structural Challenges Amid Doubts Over Data
  Energy Sector Outlook 2025: AI's Role and Market Dynamics
  Oil Prices Dip Slightly Amid Focus on Russian Sanctions and U.S. Inflation Data
  U.S. Stocks vs. Bonds: Are Diverging Valuations Signaling a Shift?
  US Gas Market Poised for Supercycle: Bernstein Analysts
  Mexico's Undervalued Equity Market Offers Long-Term Investment Potential


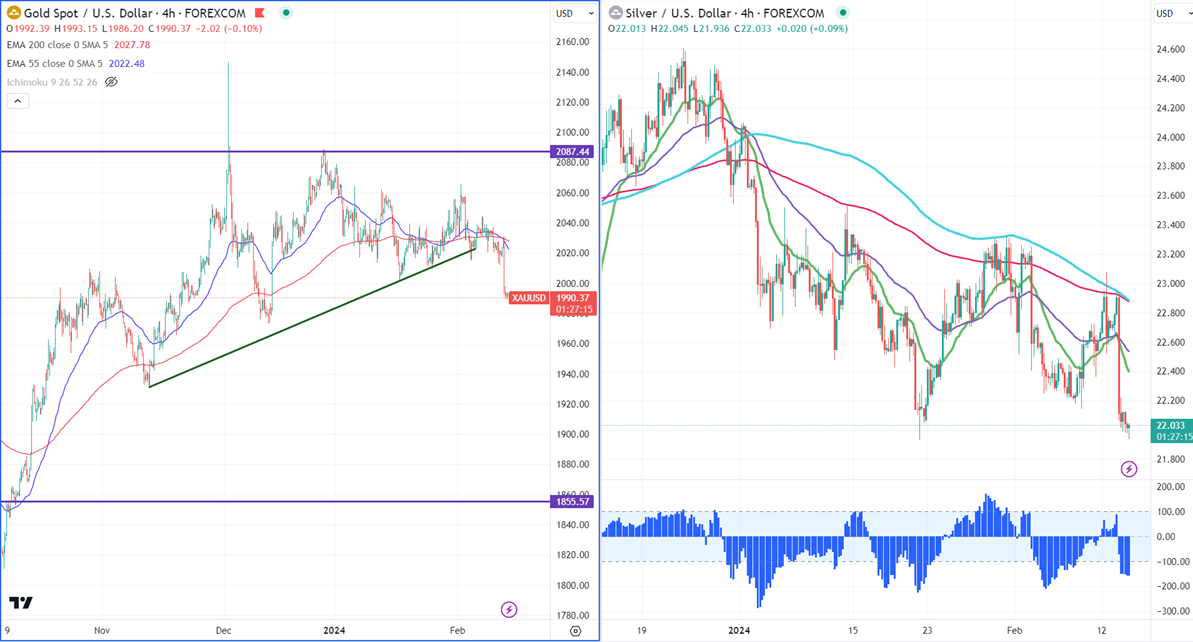
Gold -
Ichimoku Analysis (4-hour chart)
Tenken-Sen- $2010.05
Kijun-Sen- $2013
Gold pared most of its gains, after the US inflation data. The US yearly CPI fell to 3.1 in Jan from 3.4% This has decreased the chance of an early rate by the Fed and pushed the yield and Dollar higher. The yellow metal hit a low of $1986 at the time of writing and is currently trading around $1988.70.
According to the CME Fed watch tool, the probability of a no-rate cut in Mar increased to 91% from 81% a week ago.
US dollar index- Bullish. Minor support around 104.50/103.80. The near-term resistance is 105/106.
Factors to watch for gold price action-
Global stock market- Bullish (negative for gold)
US dollar index - bullish (negative for gold)
US10-year bond yield- Bullish (negative for gold)
Technical:
The near–term support is around $1970, a break below targets of $1956/$1930. The yellow metal faces minor resistance around $2000 and a breach above will take it to the next level of $2020/$2030/$2045/$2060/$2070/$2080/$2100.
It is good to buy on dips around $1970 with SL around $1950 for TP of $2040/$2065/$2080.
.
Silver-
Silver is hovering between $22.72 and $21.93 for the past two weeks. Any weekly close below $22.24 (200-W EMA) confirms further weakness, a dip to $21.60/$21/$20.68 is possible. It trades below 21, 55- EMA, and 200 EMA in the 4-hour chart. The near-term resistance is around $22.50 and a break above confirms an intraday bullishness. A jump to $22.75/$23/$23.35 is possible.
Crude oil-
WTI crude oil holds above $76 on Middle East tension. However, gains are limited due to the chance of delay in early rate cut by the fed.
Major resistance- $78/$80. Significant support- $74/$72.


