


 FxWirePro- Woodies Pivot(Major)
  Euro Retreats as Geopolitical Tensions Surge: EURUSD Eyes 1.1400 Floor Amid Safe-Haven Demand
  Ethereum Retreats Toward USD 2,000: Technicals Signal Caution as ETH Mimics Bitcoin’s Pullback
  EUR/JPY Bulls Charge: Eyeing 186.00 as Euro Strength Intensifies
  FxWirePro: USD/ZAR fibo rejection triggers sizeable pullback
  NZDJPY Bears Take Control: New Zealand Dollar Retreats as 92 Resistance Holds Firm
  FxWirePro: USD/JPY firms as Trump's address on Gulf war spark fresh concerns
  FxWirePro: AUD/USD downside pressure builds, key support level in focus
  FxWirePro:NZD/USD drifts lower, could be on verge of bigger drop
  FxWirePro- Major European Indices
  FxWirePro- Major Pair levels and bias summary
  FxWirePro: USD/ZAR sustains gains as uptrend remains strong
  FxWirePro: EUR/ NZD steadies around 2.0150, retains bid tone
  FxWirePro- Major Crypto levels and bias summary
  Aussie Retreats Against the Yen: AUDJPY Bears Target 108 as 110 Resistance Holds Firm


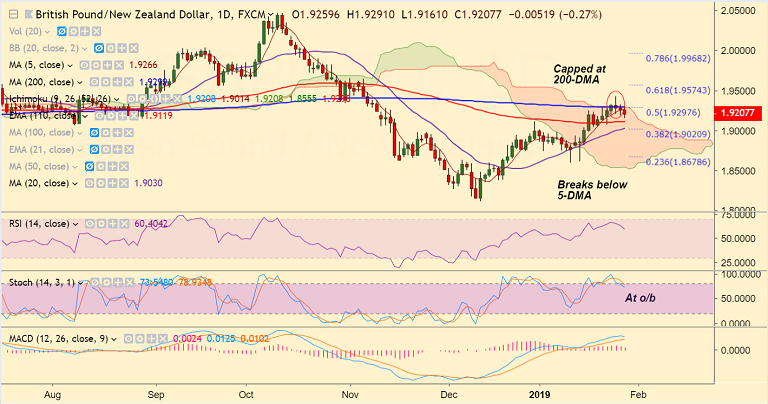
GBP/NZD chart on Trading View used for analysis
- GBP/NZD trades 0.29% lower at 1.9205 at 0915 GMT, bias lower.
- The pair has failed to close above 200-DMA and recovery attempts are capped at 200-DMA which is offering stiff resistance.
- The pair is in the red for the 3rd straight session, eyes 110-EMA at 1.9119 on further weakness.
- Technical indicators are turning slightly bearish on the daily charts.
- We see strong support at 110-EMA at 1.9119, break below will see accentuation of weakness.
Support levels - 1.9119 (110-EMA), 1.91, 1.9030 (20-DMA)
Resistance levels - 1.9299 (200-DMA), 1.9425 (Jan 25 high), 1.9574 (61.8% Fib)
For details on FxWirePro's Currency Strength Index, visit http://www.fxwirepro.com/currencyindex.


