


 Elon Musk’s Empire: SpaceX, Tesla, and xAI Merger Talks Spark Investor Debate


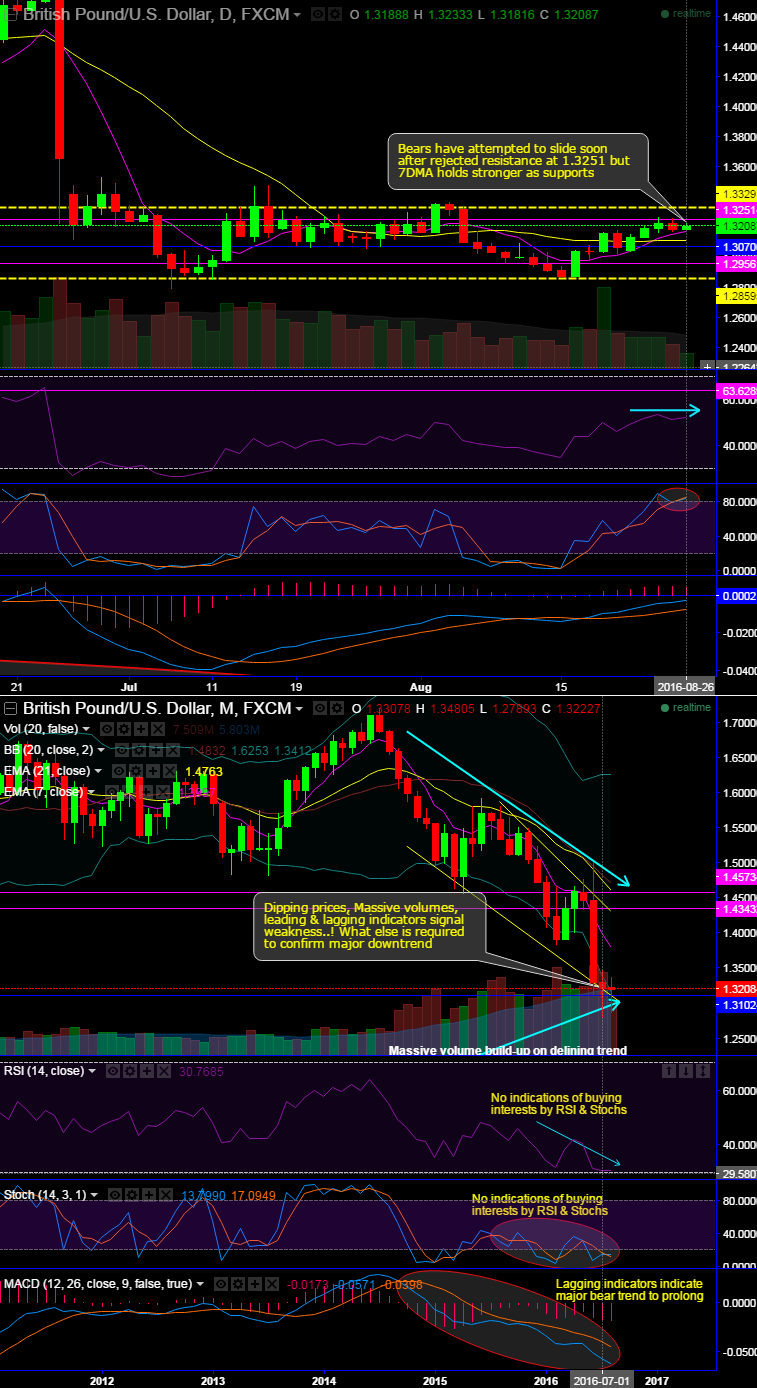
Bears have been attempting to slide from last three days soon after rejected resistance at 1.3251 but 7DMA holds stronger as supports on daily charts.
Today again day highs haven’t been able to sustain and has rejected resistance at 1.3251 levels (see price behaviour from last 3 consecutive days on daily charts).
On intraday charts, the current price whipsaws on DMAs, contemplating previous upswings the breaks below 7DMA levels to evidence bearish rout again.
RSI & Stoch are indicative of further dips on monthly charts, while current prices on this plotting are well below EMAs.
RSI: Currently, RSI (14) on daily charts has been indecisive.
Stochastic: Slow stochastic noises with the attempts of %D line cross over near overbought region, which means that it alarms bears trying to take over the tight rallies.
On long-term perspectives, dipping prices, Massive volumes, leading & lagging indicators signal weakness..! What else is required to confirm major downtrend?
Monthly MACD’s bearish crossover continued to move below zero level which is bearish region.
Hence, contemplating above technical reasoning, although there are short-term buying opportunities, we would still foresee further GBP weakness in medium terms on BoE's further rate cut stances and recent alerts of the economic risks if Britain votes to leave the European Union, while UK’s unchanged GDP (QoQ) has not changed anything much on macro perspectives.


