


 FxWirePro: AUD/USD retreats slightly but trend is still bullish
  FxWirePro- Major European Indices
  FxWirePro- Major Pair levels and bias summary
  FxWirePro: USD/ZAR edges lower ,investors remain on edge
  FxWirePro: GBP/USD biased higher but rally currently stretched
  FxWirePro: EUR/AUD downtrend loses steam but outlook still bearish
  Energy Surge Ignites US Inflation: USDCHF Eyes Support Amid Dollar Sell-Off
  Bitcoin’s Volatile Reset: ETFs Rebound as Bulls Eye USD 80,000 Milestone
  FxWirePro: USD/CNY neutral in the near-term, scope for downward resumption
  FxWirePro: GBP/USD bulls remain cautiously optimistic
  FxWirePro: GBP/NZD down trend loses steam, remains on bearish path
  FxWirePro- Major Pair levels and bias summary
  FxWirePro:NZD/USD uptrend loses momentum but bullish setup remains
  Ethereum Consolidates: Bullish Technicals Point to a Potential $3,000 Breakout
  FxWirePro: USD/CAD extends decline on broad dollar weakness


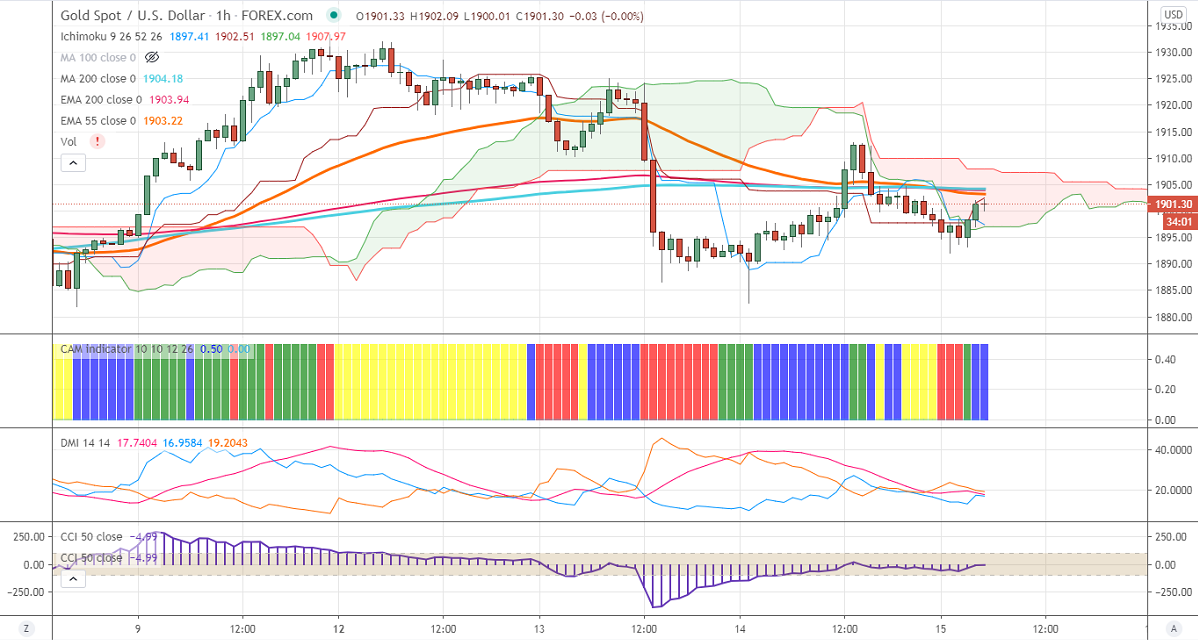
Ichimoku analysis (1- Hour chart)
Tenken-Sen- $1898
Kijun-Sen- $1901.50
Gold continues to trade in a narrow range between $1933 and $1882 for the past three days. The hopes of fresh stimulus from the US are putting pressure on Safe-haven assets like gold. DXY has halted its two days of the bullish trend. Any break below 93.25 will drag the index down till 93/92.50.
Economic data:
The annual US producer price rose to 1.2% in September compared to a forecast of 0.9%. The PPI for final demand came at 0.4% in September vs 0.3% in August. Markets eye US Philly fed manufacturing index and Initial jobless claims for further direction.
Technical:
In the Hourly chart, Gold is trading slightly below the long-term moving average (200- MA) and Kijun-Sen. Any break above $1904 (200- MA) will take the pair till $1910/$1920. On the flip side, near term intraday support is around $1880 and any indicative break below that level will take the pair till $1860/$1848.
It is good to buy on dips around $1895-96 with SL around $1880 for the TP of $1920/$1933.


