


 BTC Flat at $89,300 Despite $1.02B ETF Exodus — Buy the Dip Toward $107K?
  Elon Musk’s Empire: SpaceX, Tesla, and xAI Merger Talks Spark Investor Debate
  JPMorgan Lifts Gold Price Forecast to $6,300 by End-2026 on Strong Central Bank and Investor Demand


Gold bears in the major trend breaches below rising wedge support, back-to-back shooting stars have occurred at $1,325.03 and $1,315.20 levels respectively. As a result, you could see steep price slumps below EMAs with bearish crossovers. For now, it is on the verge of dragging more slumps to hit fresh 1-year lows on bearish EMA & MACD crossovers.
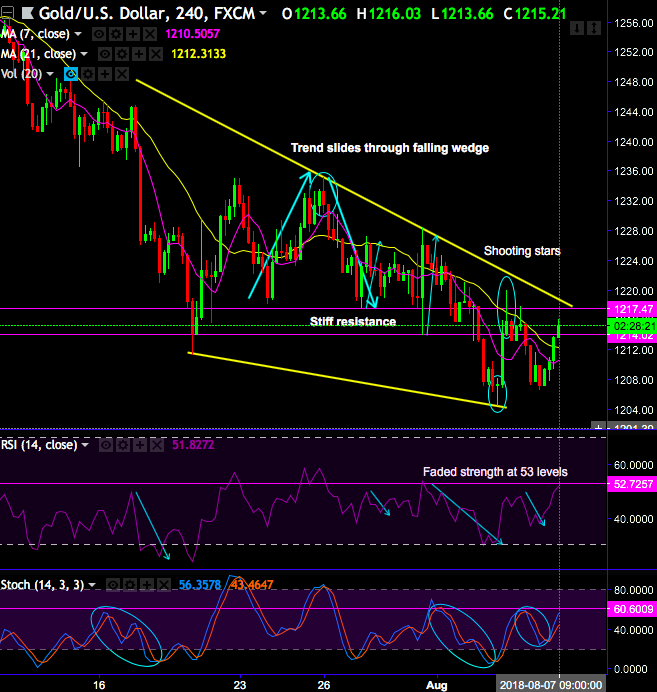
While both leading oscillators (RSI and stochastic curves) show downward convergence to the price dips to signal further weakness.
Whereas the precious yellow metal price in minor trend has been sliding through falling wedge pattern.
While the bulls bounce-back on hammer occurrence at wedge base, on the contrary, shooting star countered the rallies. For now, more intraday rallies likely on break-out of stiff resistance of $1,214.02 levels, whereas bears bank on next stiff resistance at $1,217.47 levels (which is also wedge resistance).
While both leading oscillators (RSI and stochastic curves) show upward convergence to the prevailing rallies but shows faded strength at 53 levels.
Gold prices are surging higher today from the lows of $1,206.43 to the recent highs of $1,216.03, currently trading at $1,214.82 levels.
Trade tips: Contemplating mild bullish sentiments, we advocate buying XAUUSD (1%) in the money -0.79 delta put options of 1w tenors, the rationale for choosing this derivative instrument is that the deep in the money call with a very strong delta would move in tandem with the underlying move.
Currency Strength Index: FxWirePro's hourly USD is inching at 9 (which is absolutely neutral), while articulating (at 10:58 GMT). For more details on the index, please refer below weblink:


