


 Urban studies: Doing research when every city is different
  FxWirePro: EUR/AUD gaining momentum for a move towards 1.6800 level
  U.S. Stocks vs. Bonds: Are Diverging Valuations Signaling a Shift?
  UBS Projects Mixed Market Outlook for 2025 Amid Trump Policy Uncertainty
  Ethereum Retreats Toward USD 2,000: Technicals Signal Caution as ETH Mimics Bitcoin’s Pullback
  FxWirePro: USD/CNY gains some ground but bearish outlook persists
  FxWirePro- Major Crypto levels and bias summary
  FxWirePro:NZD/USD remains vulnerable as Trump's latest deadline leaves investors on edge
  China’s Growth Faces Structural Challenges Amid Doubts Over Data
  US Gas Market Poised for Supercycle: Bernstein Analysts
  Global Markets React to Strong U.S. Jobs Data and Rising Yields
  FxWirePro: USD/JPY firms as Trump's address on Gulf war spark fresh concerns
  China's Refining Industry Faces Major Shakeup Amid Challenges
  NZDJPY Bears Take Control: New Zealand Dollar Retreats as 92 Resistance Holds Firm
  Gold Prices Fall Amid Rate Jitters; Copper Steady as China Stimulus Eyed
  FxWirePro: EUR/ NZD steadies around 2.0150, retains bid tone
  Energy Sector Outlook 2025: AI's Role and Market Dynamics


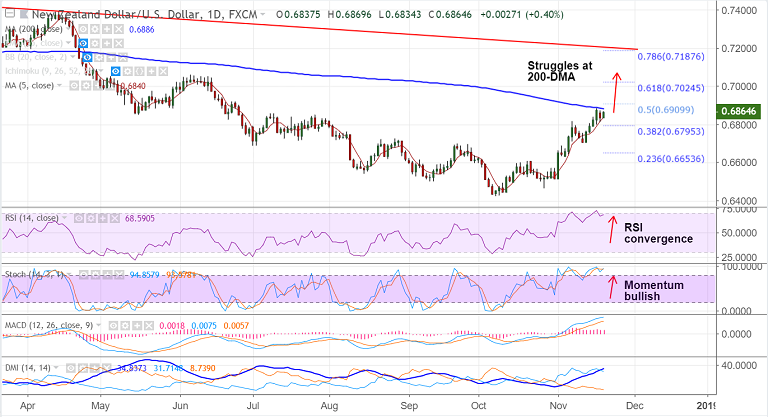
NZD/USD chart on Trading View used for analysis
- NZD/USD pauses upside at 200-DMA, bias remains bullish.
- Momentum studies are bullish, with nice convergence on RSI and Stochs.
- MACD and DMI also support upside in the pair. Scope for further upside on break above 200-DMA.
- On the weekly charts, price has broken above 55-EMA and Bollinger Bands are widening suggesting rise in volatility.
- Next immediate resistance above 200-DMA lies at 50% Fib at 0.69 ahead of 0.6979 (110W EMA) and 0.6989 (200W SMA).
- Rejection at 200-DMA could see drag till 20-DMA. Break below cloud negates bullish bias.
Support levels - 0.6811 (38.2% Fib), 0.6706 (Nov 12, 13 low), 0.6689 (20-DMA)
Resistance levels - 0.69 (50% Fib), 0.6979 (110W EMA), 0.6989 (200W SMA)
Recommendation: Stay long on break above 200-DMA, SL: 0.6830, TP: 0.69/ 0.6980
For details on FxWirePro's Currency Strength Index, visit http://www.fxwirepro.com/currencyindex.


