


 JPMorgan Lifts Gold Price Forecast to $6,300 by End-2026 on Strong Central Bank and Investor Demand
  Nasdaq Proposes Fast-Track Rule to Accelerate Index Inclusion for Major New Listings


The USD weakness that started after Donald Trump’s press conference continued all through the day yesterday.
We aren’t sure whether Donald Trump's presidency proves beneficial to FX markets or stocks or not, his press conferences are likely to make for exciting market swings.
That was borne out on Wednesday, when Mr. Trump began a press conference by railing against high drug prices, saying pharmaceutical companies are "getting away with murder.
We see some risk of profit taking on the Trump trade (long equities, short duration, long the dollar) into this month's inauguration given the strong performance over the past two months. This is also because several investors believe that markets have priced in already a great deal of positive Trump policies but not much of negative Trump policies (which might come first and soon after inauguration). Indeed in this week’s Cross Asset Volatility Strategy piece we recommended several hedges.
Which types of investors are more likely to take profit on the Trump trade leaving markets vulnerable?
To answer this question we update the betas of various types of investors.
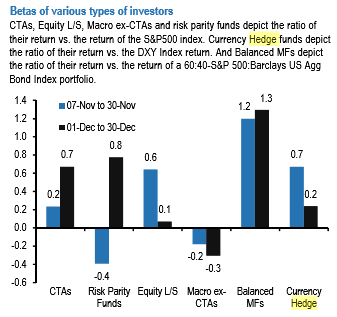
This is shown in the chart which demonstrates the beta, i.e. relative performance, of CTAs, Macro HFs ex CTAs, Risk Parity funds and Equity L/S HFs to the S&P500 index, the beta of currency HFs to the DXY index and the beta of Balanced Mutual Funds to a 60% equity/40% bond portfolio.
Above figure advocates that Balanced Mutual Funds, Risk Parity Funds, and CTAs are the main sources of vulnerability as they had all raised their betas to high levels in December relative to the previous month.
CTAs, Equity L/S, Macro ex-CTAs, and risk parity funds depict the ratio of their return vs. the return of the S&P500 index. Currency Hedge funds depict the ratio of their return vs. the DXY Index return. And Balanced MFs depict the ratio of their return vs. the return of a 60:40 - S&P 500: Barclays US Agg Bond Index portfolio.
The rolling 21-day beta of the Barclay Hedge FX index with the JPM USD tradable index vs. the net spec position in the USD as reported by the CFTC. Spec is the non-commercial category from the CFTC. Net spec position below is with one week’s lag.


