


 Fed May Resume Rate Hikes: BofA Analysts Outline Key Scenarios
  Urban studies: Doing research when every city is different
  China's Refining Industry Faces Major Shakeup Amid Challenges
  European Stocks Rally on Chinese Growth and Mining Merger Speculation
  US Futures Rise as Investors Eye Earnings, Inflation Data, and Wildfire Impacts
  2025 Market Outlook: Key January Events to Watch
  Mexico's Undervalued Equity Market Offers Long-Term Investment Potential
  Global Markets React to Strong U.S. Jobs Data and Rising Yields
  Lithium Market Poised for Recovery Amid Supply Cuts and Rising Demand


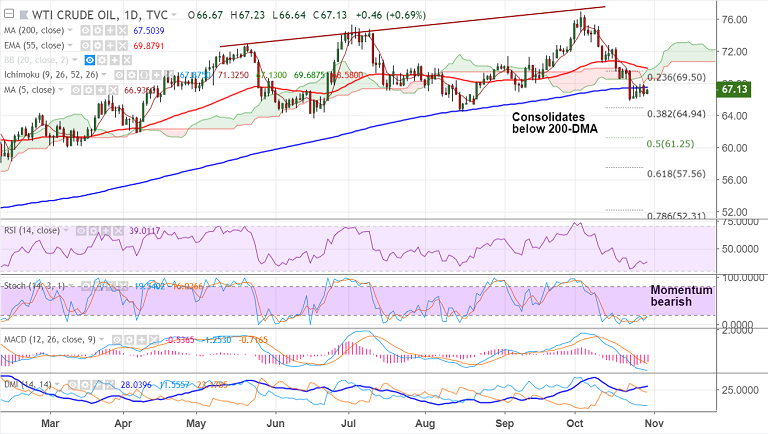
US oil chart on Trading View used for analysis
- US oil is extending consolidation below 200-DMA, bias remains bearish.
- WTI price holds above $67 per barrel and we see further gains on retrace above 200-DMA.
- Markets remain wary about the recovery amid global economic growth concerns, ongoing US-China trade war and the European political woes.
- Technical indicators on intraday charts are neutral, but break above 200-DMA could see some bullishness.
- 5-DMA has turned north and retrace above 200-DMA eyes 110-EMA at 69 ahead of 55-EMA at 69.87.
- Rejection at 200-DMA could see continuation on downside. Next major bear target lies at 38.2% Fib at 64.94.
- Focus on the US core PCE data and weekly US fuel stocks report for the next direction in the prices.
Support levels - 66.93 (5-DMA), 66, 64.94 (38.2% Fib)
Resistance levels - 67.50 (200-DMA), 69 (110-EMA), 69.87 (55-EMA)
For details on FxWirePro's Currency Strength Index, visit http://www.fxwirepro.com/currencyindex.


