


 Energy Sector Outlook 2025: AI's Role and Market Dynamics
  UBS Projects Mixed Market Outlook for 2025 Amid Trump Policy Uncertainty
  S&P 500 Relies on Tech for Growth in Q4 2024, Says Barclays
  Oil Prices Dip Slightly Amid Focus on Russian Sanctions and U.S. Inflation Data
  Moldova Criticizes Russia Amid Transdniestria Energy Crisis
  European Stocks Rally on Chinese Growth and Mining Merger Speculation
  UBS Predicts Potential Fed Rate Cut Amid Strong US Economic Data


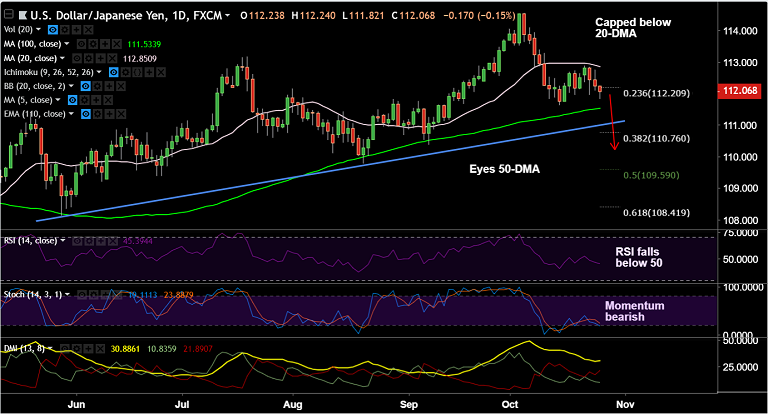
USD/JPY chart on Trading View used for analysis
- USD/JPY trades in the red for the 3rd consecutive session, bias lower.
- S&P 500 futures have dropped well below the key support of the 50-week EMA, emboldening the bears.
- The pair has retraced dip below 112 handle and is currently trading at 112.15 after hitting session lows at 111.82.
- The combination of market risk in equities, political risk in Europe (Brexit and Italy) and economic risk around the globe will keep safe havens in demand.
- Focus now on the forthcoming Bank of Japan (BoJ) policy meeting scheduled for October 31.
- Also, U.S. Q3 GDP data due later this week will be watched for clues on further direction.
- Price has broken below 23.6% Fib. We see scope for test of 50-DMA at 111.53 ahead of daily cloud. Violation at daily cloud will see further bearishness.
- On the upside, 20-DMA is major resistance. We see bearish invalidation on break above.
Support levels - 112 (major trendline support), 111.53 (50-DMA)
Resistance levels - 112.20 (23.6% Fib), 112.85 (20-DMA), 113.17 (July 19 high)
Recommendation: Good to stay short on upticks, SL: 112.90, TP: 111.55/ 111
For details on FxWirePro's Currency Strength Index, visit http://www.fxwirepro.com/currencyindex.


