


 FxWirePro: AUD/USD spikes as Trump announces two-week Iran ceasefire
  Bitcoin Breaks the $70,000 Barrier: Bulls Target the $80,000 Horizon as Geopolitical Relief Ignites Crypto Markets
  FxWirePro- Major Crypto levels and bias summary
  FxWirePro: EUR/ NZD downside pressure builds, key support level in focus
  FxWirePro- Woodies Pivot(Major)
  Pound Sterling Power: GBP/JPY Secures Third Day of Gains as Global Risk Tensions Recede
  FxWirePro- Major Crypto levels and bias summary
  FxWirePro: EUR/AUD falls below 1.6600 level, plunge to test a key fibo grows
  NZD/JPY Rockets as Kiwi Dollar Resilience Defies the Oil Shock
  Ethereum Braces for Volatility: Technicals Turn Bearish as Geopolitical Tensions Loom
  FxWirePro: USD/ JPY slips as yen rallies after Mideast ceasefire declaration
  FxWirePro- Major Pair levels and bias summary
  FxWirePro: GBP/NZD reverses course, bias back to downside
  EUR/JPY Breaks Out: Euro Surges Past 185.00 Resistance Amid Strong Bullish Momentum
  FxWirePro: GBP/AUD downtrend extends, eyes 1.8900 evel
  FxWirePro: USD/CNY falls to three-year high, scope for further downside
  FxWirePro: USD/ZAR slips sharply lower as US-Iran ceasefire lifts risk appetite


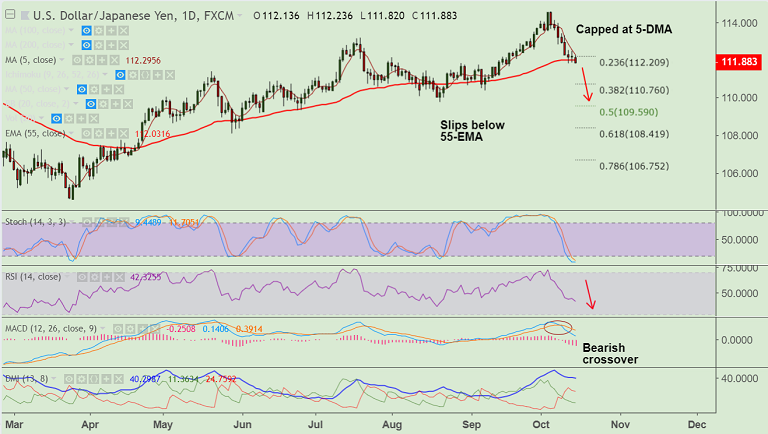
USD/JPY chart on Trading View used for analysis
- USD/JPY opened the week's trade with a bearish gap, bias lower.
- The pair has slipped below 112 handle and is trading 0.26% lower on the day.
- Upside remains capped at 5-DMA and the pair has slipped below 55-EMA.
- We see scope for test of lower Bollinger Band at 111.56. Further weakness will see drag till 38.2% Fib at 110.79.
- On the data front, focus shall be on U.S. retail sales, JOLTS, Industrial production and housing starts.
- FOMC minutes will be watched for longer-term topics such as alternate monetary policy frameworks and the balance sheet.
Support levels - 111.55 (lower BB), 111.30 (110-EMA), 110.76 (38.2% Fib)
Resistance levels - 112.30 (5-DMA), 112.65 (21-EMA), 112.97 (20-DMA)
Recommendation: Stay short below 55-EMA, SL: 112.30, TP: 111.55/ 111/ 110.76
For details on FxWirePro's Currency Strength Index, visit http://www.fxwirepro.com/currencyindex.


