


 Ethereum Retreats Toward USD 2,000: Technicals Signal Caution as ETH Mimics Bitcoin’s Pullback
  FxWirePro: GBP/USD outlook weaker on renewed downside pressure
  FxWirePro: EUR/AUD gaining momentum for a move towards 1.6800 level
  FxWirePro: USD/CNY gains some ground but bearish outlook persists
  FxWirePro: GBP/NZD remains buoyant, looks to extend gains
  FxWirePro: USD/CAD runs out of steam but maintains bullish outlook
  FxWirePro- Major Crypto levels and bias summary
  FxWirePro- Major Pair levels and bias summary
  Aussie Retreats Against the Yen: AUDJPY Bears Target 108 as 110 Resistance Holds Firm
  Bitcoin Battles Volatility: Institutional Support Eyes USD 64,000 Floor Amid Geopolitical Tensions
  Euro Retreats as Geopolitical Tensions Surge: EURUSD Eyes 1.1400 Floor Amid Safe-Haven Demand
  FxWirePro- Major European Indices
  FxWirePro: GBP/NZD range to extend until there is game changing news
  FxWirePro- Woodies Pivot(Major)
  FxWirePro- Major Pair levels and bias summary
  FxWirePro: EUR/ NZD steadies around 2.0150, retains bid tone


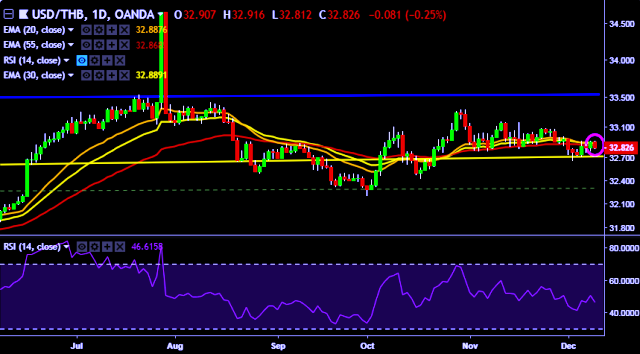
- USD/THB is currently trading around 32.82 marks.
- It made intraday high at 32.91 and low at 32.81 marks.
- Intraday bias remains neutral till the time pair moves in stiff boundaries from 32.90 to 32.70 marks.
- On the top side, key resistances are seen at 32.92, 33.07, 33.15, 33.32 and 33.52 marks respectively.
- Alternatively, a daily close below 32.72 will drag the parity down towards key supports around 32.65, 32.57, 32.42, 32.20 and 32.07 marks respectively.
- Important to note here that 20D, 30D and 55D EMA heads up and confirms the bullish trend in a daily chart.
Positioning is inconclusive at this point, with prices offering no clear cut signal to initiate a long or short trade. We will continue to remain on sidelines for the time being.


