


 FxWirePro- Major Crypto levels and bias summary


In the recent times of empirical evidences, BTCUSD is the one which has the huge potential with rosy pictures of new innovation but with the highest turbulence surrounded with itself, you could probably understand from the technical charts of weekly timeframe. Yes, we at FxWirePro could understand this happens in every industry development stage, so does it happen in new currency revolution.
But million dollar question arises as to how do we measure its volatility, does it also follow the same asset classes such as contemporary FX pairs or equities or FIs. Let’s shed some light on this purview:
Price discrepancies are not the only way in which Bitcoin exchange stands out from other exchanges. The volatility and the price of a bitcoin are prone to significant fluctuations over short periods of time.
Well, for securities like stock, volatility is often expressed by its beta coefficient (or ‘beta’). Beta is a measure of an individual stock’s price volatility against a broader market measure, which is typically an for an instance, index like the S&P500.
Since the S&P500 is used as a proxy for the market then the S&P500 is assigned a beta value of 1. Thus, a stock with a beta of 1.2 has 20% greater price volatility than the S&P500 index. This has been the usual interpretation.
So, the laborious requirement is that how do we measure cryptocurrency’s vols:
To determine with a beta coefficient for bitcoin, a number of key inputs, estimations and assumptions are essential – such as a risk-free rate of return. In today’s Zero Lower Bound world, central banks have effectively set nominal interest rates as very close to nothing.
Thus, the risk-free rate of return is arguably also zero, which presents methodological issues.
There is also the question of which index to measure bitcoin’s volatility against. Should the Dollar Index (DXY) be used? Or perhaps a basket of alternative assets?
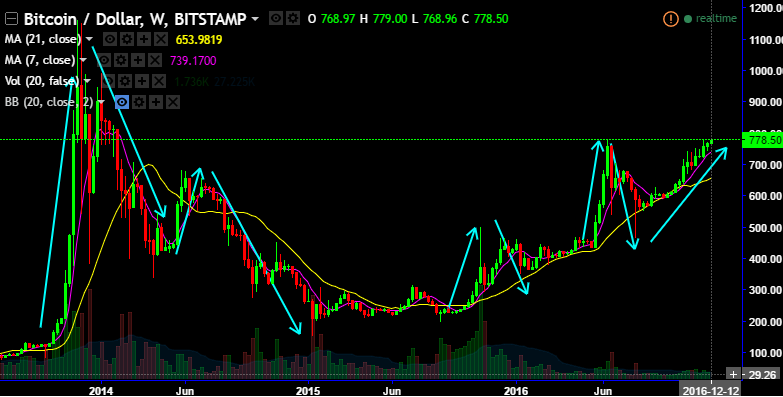
Please be noted that the above ogive chart has been the diagrammatic representation of the standard deviation of BTCUSD since January 2012 to November 2016. Please observe the ogive curve that denotes standard deviation in Oct 2013, and the price has collapsed from the peaks of 1,163 to 382.21 just within a span of four months and shot up again to 995 in just three months. Same has been the case in late May’2016 to late June 2016 (huge turbulence is seen, when SD curve has been oscillating between zero to five.
Hence, the foreign traders with BTC export payable exposures have been advocated with a wise hedging vehicles with bitcoin exchanges.


