


 FxWirePro- Major Pair levels and bias summary
  Bitcoin Battles Volatility: Institutional Support Eyes USD 64,000 Floor Amid Geopolitical Tensions
  FxWirePro: AUD/USD downside pressure builds, key support level in focus
  FxWirePro: EUR/AUD eases slightly but trend is still bullish
  FxWirePro: USD/CNY gains some ground but bearish outlook persists
  FxWirePro: USD/CAD runs out of steam but maintains bullish outlook
  FxWirePro- Major European Indices
  Aussie Retreats Against the Yen: AUDJPY Bears Target 108 as 110 Resistance Holds Firm
  FxWirePro- Major Crypto levels and bias summary
  FxWirePro: GBP/NZD remains buoyant, looks to extend gains
  FxWirePro- Woodies Pivot(Major)
  FxWirePro: GBP/USD outlook weaker on renewed downside pressure
  Euro Retreats as Geopolitical Tensions Surge: EURUSD Eyes 1.1400 Floor Amid Safe-Haven Demand
  FxWirePro: GBP/NZD range to extend until there is game changing news
  FxWirePro: EUR/ NZD steadies around 2.0150, retains bid tone


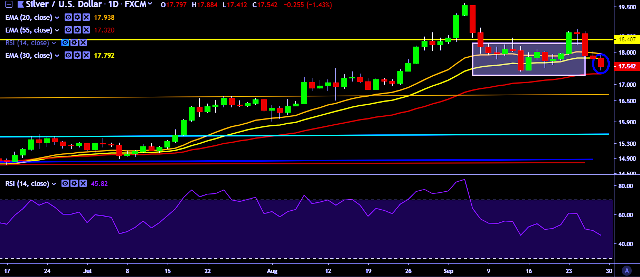
- XAG/USD is currently trading around $17.53 marks.
- It made intraday high at $17.88 and low at $17.41 levels.
- Intraday bias remains bearish till the time pair holds key resistance at $17.89 mark.
- A daily close above $17.80 will test key resistances at $18.02, $18.17, $18.45, $18.76, $19.07 and $19.27 marks respectively.
- On the other side, a daily close below $17.42 will take the parity down towards key supports at $17.26, $17.07, $16.94 and $16.72 marks respectively.
- Important to note here that 20D, 30D and 55D EMA heads up and confirms the bullish trend in a daily chart. Current downside movement is short term trend correction only.
We prefer to take short position on XAG/USD around $17.58, stop loss at $17.90 and target of $17.26/$17.07.


