


 Trump and Merck KGaA Partner to Slash IVF Drug Costs and Expand Fertility Coverage
  SpaceX’s Starship Completes 11th Test Flight, Paving Way for Moon and Mars Missions
  Neuralink Plans High-Volume Brain Implant Production and Fully Automated Surgery by 2026
  Astronomers have discovered another puzzling interstellar object − this third one is big, bright and fast
  FDA Lifts REMS Requirement for CAR-T Cell Cancer Therapies
  Tabletop particle accelerator could transform medicine and materials science
  NASA's Artemis II Mission: First Crewed Lunar Journey Since Apollo
  Trump Administration to Launch Autism Initiatives Targeting Acetaminophen Use and New Treatment Options
  NASA Artemis II: First Crewed Moon Mission Since Apollo Takes Four Astronauts on 10-Day Lunar Journey
  SpaceX Prioritizes Moon Mission Before Mars as Starship Development Accelerates
  Is space worth the cost? Accounting experts say its value can’t be found in spreadsheets
  Neuren Pharmaceuticals Surges on U.S. Patent Win for Rare Disorder Drug
  Lost in space: MethaneSat failed just as NZ was to take over mission control – here’s what we need to know now


Fifty years ago, U.S. scientists launched a satellite that dramatically changed how we see the world.
It captured images of Earth’s surface in minute detail, showing how wildfires burned landscapes, how farms erased forests, and many other ways humans were changing the face of the planet.
The first satellite in the Landsat series launched on July 23, 1972. Eight others followed, providing the same views so changes could be tracked over time, but with increasingly powerful instruments. Landsat 8 and Landsat 9 are orbiting the planet today, and NASA and the U.S. Geological Survey are planning a new Landsat mission.
The images and data from these satellites are used to track deforestation and changing landscapes around the world, locate urban heat islands, and understand the impact of new river dams, among many other projects. Often, the results help communities respond to risks that may not be obvious from the ground.
Here are three examples of Landsat in action, from The Conversation’s archive.
Tracking changes in the Amazon
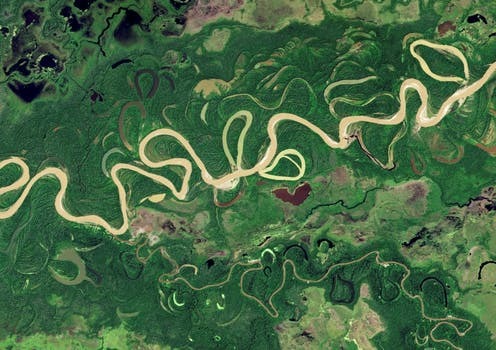
When work began on the Belo Monte Dam project in the Brazilian Amazon in 2015, Indigenous tribes living along the Big Bend of the Xingu River started noticing changes in the river’s flow. The water they relied on for food and transportation was disappearing.
Upstream, a new channel would eventually divert as much as 80% of the water to the hydroelectric dam, bypassing the bend.
The consortium that runs the dam argued that there was no scientific proof that the change in water flow harmed fish.
But there is clear proof of the Belo Monte Dam project’s impact – from above, write Pritam Das, Faisal Hossain, Hörður Helgason and Shahzaib Khan at the University of Washington. Using satellite data from the Landsat program, the team showed how the dam dramatically altered the hydrology of the river.
The front satellite image shows the Big Bend of the Xingu River on May 26, 2000, before the Belo Monte Dam project began. Move the slider to the left to see the same region on July 20, 2017.
“As scientists who work with remote sensing, we believe satellite observations can empower populations around the world who face threats to their resources,” Das and his colleagues write.
It’s hot in the city – and even hotter in some neighborhoods
Landsat’s instruments can also measure surface temperatures, allowing scientists to map heat risk street by street within cities as global temperatures rise.
“Cities are generally hotter than surrounding rural areas, but even within cities, some residential neighborhoods get dangerously warmer than others just a few miles away,” writes Daniel P. Johnson, who uses satellites to study the urban heat island effect at Indiana University.
Neighborhoods with more pavement and buildings and fewer trees can be 10 degrees Fahrenheit (5.5 C) or more warmer than leafier neighborhoods, Johnson writes. He found that the hottest neighborhoods tend to be low-income, have majority Black or Hispanic residents and had been subjected to redlining, the discriminatory practice once used to deny loans in racial and ethnic minority communities.

Comparing maps of New York City’s vegetation and temperature shows the cooling effect of parks and neighborhoods with more trees. NASA/USGS Landsat
“Within these ‘micro-urban heat islands,’ communities can experience heat wave conditions well before officials declare a heat emergency,” Johnson writes.
Knowing which neighborhoods face the highest risks allows cities to organize cooling centers and other programs to help residents manage the heat.
The making of ghost forests
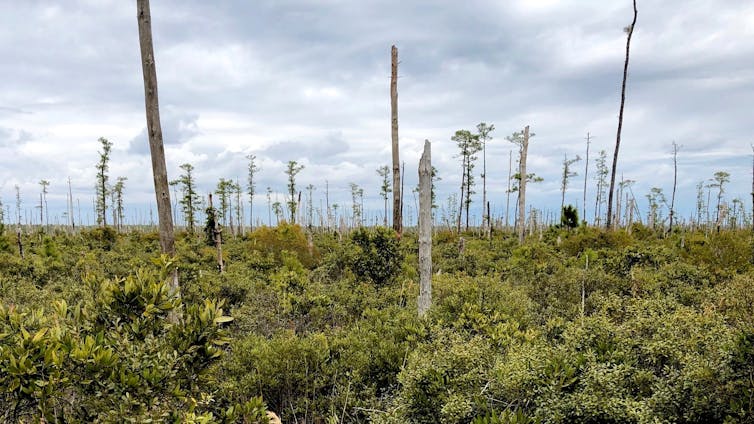
The white trunks of a ghost forest mark a coastal North Carolina landscape. Emily Ury, CC BY-ND
Satellites that scan the same areas year after year can be crucial for spotting changes in hard-to-reach regions. They can monitor snow and ice cover, and, along U.S. Atlantic coast, dying wetland forests.
These eerie landscapes of dead, often bleached-white tree trunks have earned the nickname “ghost forests.”
Emily Ury, an ecologist now at the University of Waterloo in Ontario, used Landsat data to spot wetland changes. She then zoomed in with high-resolution images from Google Earth – which includes Landsat images – to confirm that they were ghost forests.
“The results were shocking. We found that more than 10% of forested wetland within the Alligator River National Wildlife Refuge [in North Carolina] was lost over the past 35 years. This is federally protected land, with no other human activity that could be killing off the forest,” Ury writes.
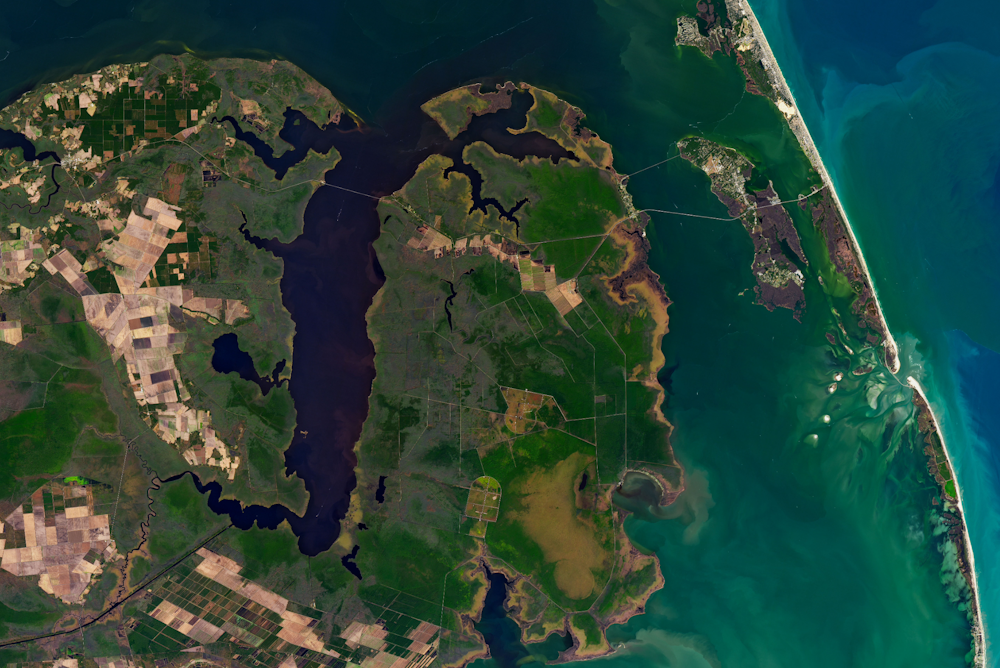
Landsat’s view of the Alligator River and refuge shows signs of ghost forests on the east side of the river. NASA Earth Observatory
As the planet warms and sea levels rise, more salt water is reaching these areas, increasing the amount of salt in the soil of coastal woodlands from Maine to Florida. “Rapid sea level rise seems to be outpacing the ability of these forests to adapt to wetter, saltier conditions,” Ury writes.
Many more stories can be found in Landsat’s images, such as an overview of the war’s effects on Ukraine’s wheat crop, and how algae blooms have spread in Florida’s Lake Okeechobee. Countless projects are using Landsat data to track global change and possibly find solutions to problems, from deforestation in the Amazon to the fires that have put Alaska on pace for another historic fire season.
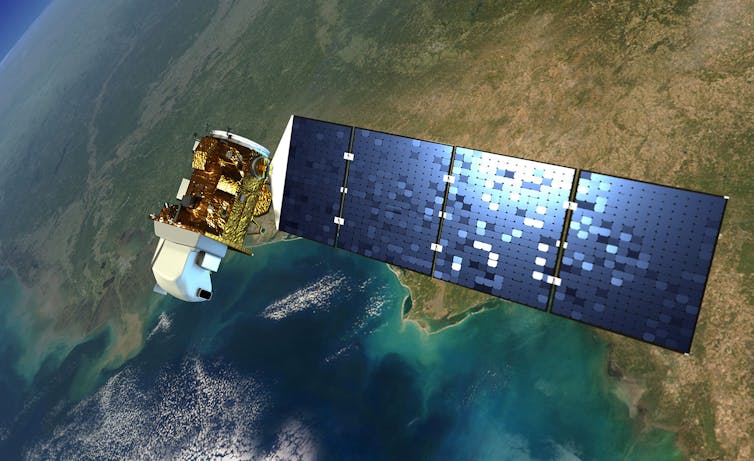
An artist’s rendering of Landsat 8. NASA/Goddard Space Flight Center Conceptual Image Lab


