


 FxWirePro- Major Crypto levels and bias summary
  FxWirePro: GBP/NZD gains some upside momentum but still bearish
  FxWirePro- Major Crypto levels and bias summary
  FxWirePro- Major Crypto levels and bias summary
  AUDJPY Bullish Surge: Strong Australian Dollar Fuels Fresh Upside as Pair Holds Above 113.50 and All EMAs Align
  FxWirePro: EUR/AUD neutral in the near term, scope for downward resumption
  FxWirePro- Major Pair levels and bias summary
  FxWirePro: USD/JPY uptrend loses steam, remains on bullish path


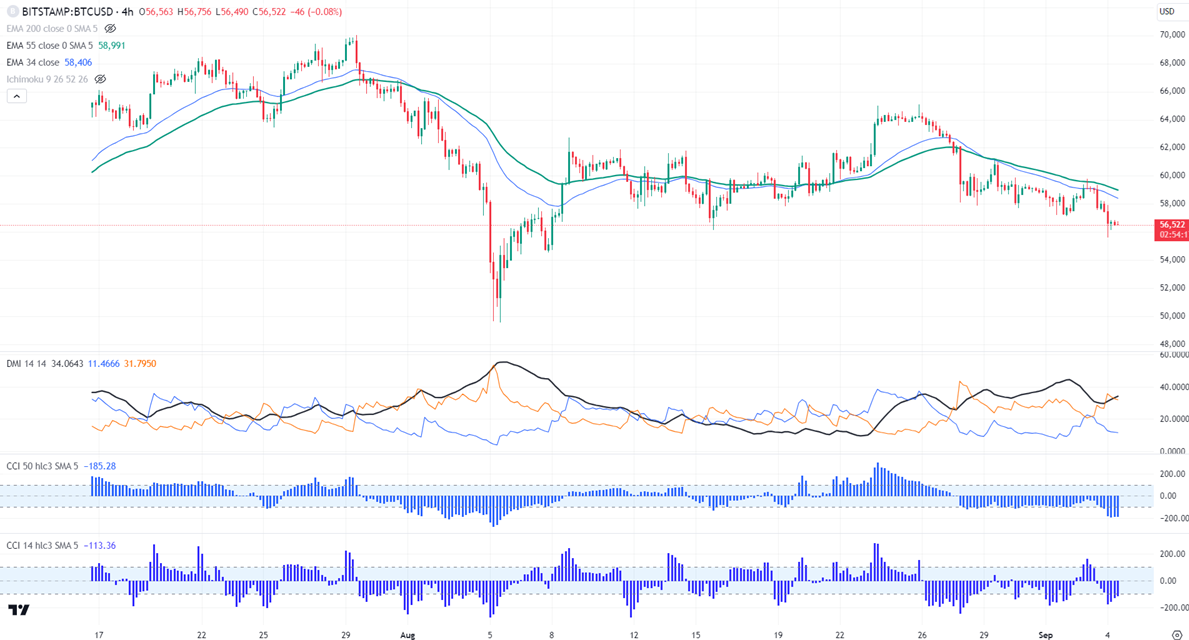
-BTCUSD declined sharply following the footsteps of the US stock market. It hit a low of $55602 and is currently trading at around $56483.
BTC showed a minor weakness after the US ISM manufacturing came below forecast raising US growth concerns.
BTC ETF has seen an outflow of $287 million, the largest since May 1st led by Fidelity FBTC outflow of $162.3 million.
According to the CME Fed watch tool, the probability of a 25 bpbs rate cut in Sep increased to 63% from 62% a week ago.
US markets -
NASDAQ (negative correlation with BTC) - Bearish (neutral for BTC). The NASDAQ market tumbled sharply led by semiconductor companies. Any close below 17780 will drag the index to 18400.
Technicals-
BTCUSD trades below the short-term moving average 34- EMA and 55 EMA and the long-term moving average (200 EMA) in the 4-hour chart.
In the daily chart also BTC holds below the short and long-term moving averages. This confirms a minor weakness.
Minor support- $54000. Any break below will take it to the next level at $53000/$50000/$46000.
Bull case-
Primary supply zone -$61200. Any break above confirms a bullish continuation. A jump to $61800/$63000/$65000/$67000/$70000 is possible.
Secondary barrier- $70000. A close above that barrier targets $750000/$80000.
Indicator (4-hour chart)
CCI (14)- Bearish
CCI (50)- Bearish
Average directional movement Index - bearish
It is good to sell on rallies around $59745-750 with SL around $56000 for TP of $50000.


