


 FxWirePro:EUR/NZD dips below lower range, bearish bias increases
  AUDJPY Bullish Surge: Strong Australian Dollar Fuels Fresh Upside as Pair Holds Above 113.50 and All EMAs Align
  JPY Action Bias: Extremely Bullish Surge Ignites Across NZD, GBP & AUD
  JPY Action Bias: CADJPY Turns Extremely Bullish While Other Pairs Hold Positive Ground
  FxWirePro:EUR/NZD stuck In narrow ranges, focus on near term support
  Gold Loses Steam After Strong U.S. Retail Sales
  FxWirePro: GBP/NZD gains some upside momentum but still bearish
  FxWirePro: USD/JPY uptrend loses steam, remains on bullish path
  NZDJPY Bullish Surge: Strong Kiwi Ignites Fresh Upside as 94 Support Holds and All EMAs Align
  ETH Stands Alone Bullish; BTC, SOL, XRP, BNB Neutral
  Major Pair Action Bias: NZDUSD Turns Bullish While Other Majors Stay Neutral
  FxWirePro: GBP/USD under pressure despite UK's modest economic growth
  FxWirePro: USD/ZAR advances as South African rand weakens amid renewed Middle East tensions
  FxWirePro: NZD/USD trades in narrow range ,outlook bullish
  Major Pair Action Bias: Extremely Bullish Surge Powers GBPUSD & NZDUSD as Bullish Momentum Ignites


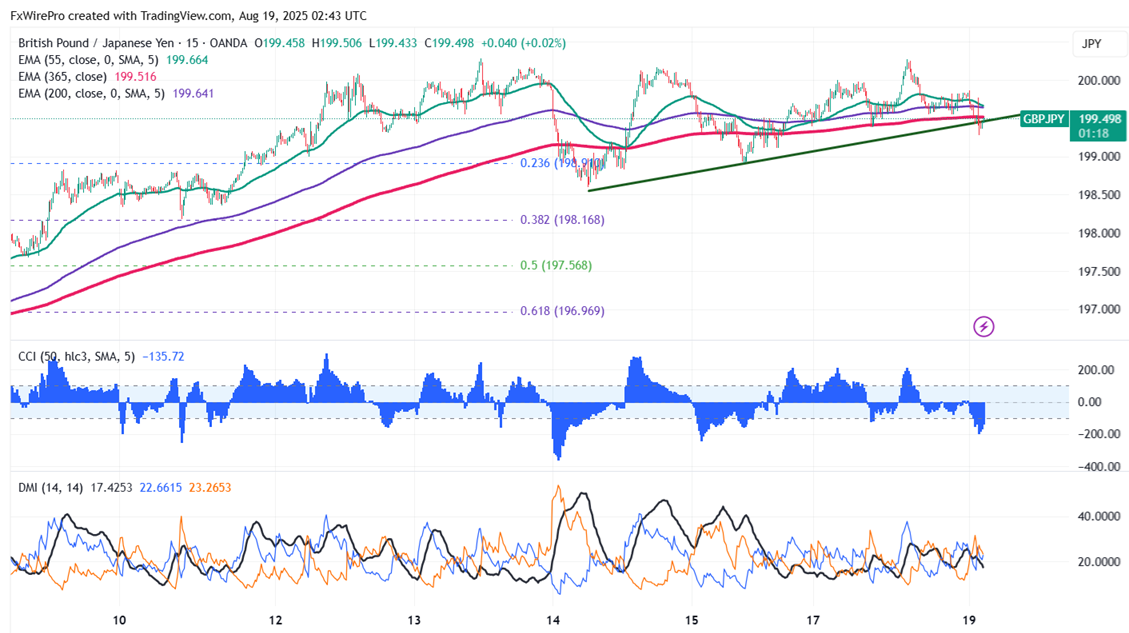
The GBP/JPY formed a double top around 200.278 and showed a minor sell-off. The pair broke minor trend line support and holds below that level. It hit an intraday low of 199.27 and is currently trading around 199.357. Intraday trend is bearish as long as the resistance at 200.28 holds.
The pair is trading below 55 and 200 EMA and 365 EMA (long-term) on the 15-minute chart, confirming a bearish trend. Any violation below 199.20 indicates the intraday trend is weak. A dip to 198.85/198.60/197.75/196.70/196.20/195.is possible. Immediate resistance is at 200.30; a breach above this level targets 202/202.98.
Market Indicators ( 15-min chart)
CCI (50)- Bearish
Directional movement index - Neutral
Trading Strategy: Buy
It Is good to buy above 200.28 with SL around 199.70 for a TP of 202/202.98


